Hyperliquid Wallet 0xc424…0c78
Open Hyperliquid perp positions of this wallet with their liquidation prices, unrealised PnL at the mark price and recent position changes, from its public on-chain account.
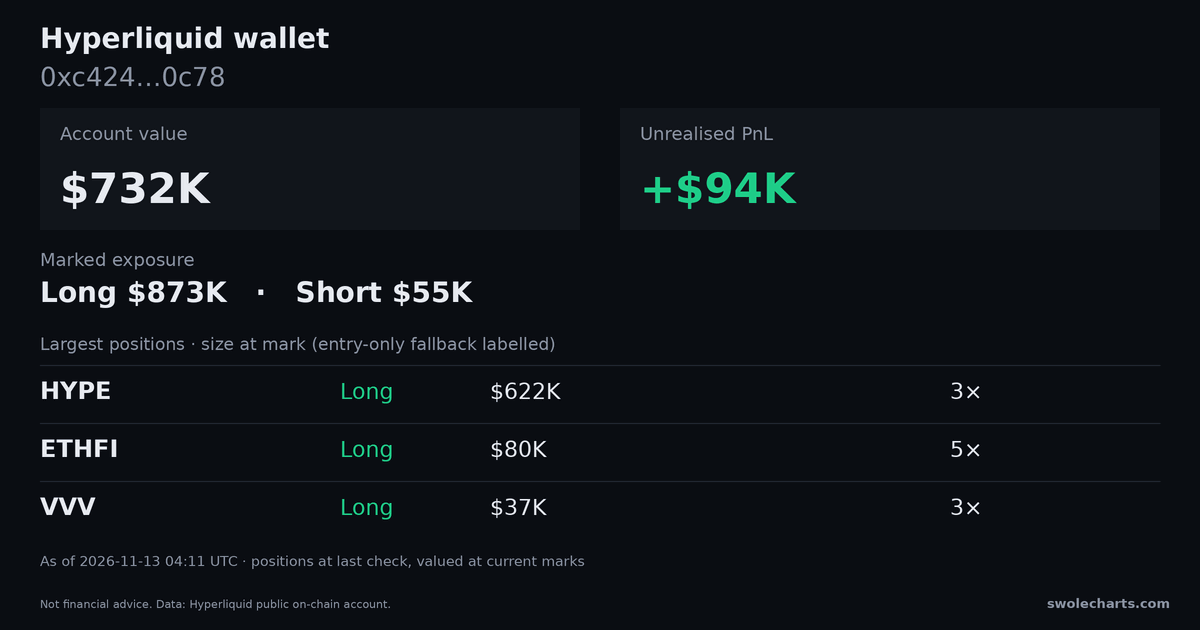
This Hyperliquid account was worth $753K at its last check, 7 min ago. It holds 69 open positions. Current marked exposure (69/69 recorded positions) is $954K: $897K long and $58K short, 1.3x its account value. Unrealised PnL at the mark price is $115K (69/69 recorded positions). The closest liquidation is its REZ short at 0.1974, +5281.41% from the price.
Share: Share on X Telegram Reddit Download the 1200×630 card
0xc4241dc9bfeb5126c0766df35a87ed3fbd630c78View on Hyperliquid's explorerMark coverage: 69/69 recorded positions.
Scope: the account value and positions above are this wallet's Hyperliquid native-perp account as of the tracker's last check (03:26 UTC, 7 min ago).
Alert me when this wallet trades: position changes seen by our tracker, which checks this wallet every 15 minutes or so (tier B). Fills between two checks are not seen.
Account value & PnL, last 30 days
PnL over each period from Hyperliquid's portfolio history for the whole account, realised and unrealised. Read from Hyperliquid's public API when you open this page, at most every 10 minutes.
Chart: TradingView Lightweight Charts™
Open positions
69 recorded positions · 69 at mark · 0 entry-only · 0 unpriced| Coin | Side | Size | Entry | Mark | Unrealised PnL | ROE | Liq. price | Distance | Leverage |
|---|---|---|---|---|---|---|---|---|---|
| HYPE | Long | $633K | 31.592 | 72.087 | $355K | +168.52% | — | — | 3× cross |
| ETHFI | Long | $83K | 1.574 | 0.6184 | -$128K | -772.33% | — | — | 5× cross |
| VVV | Long | $40K | 2.472 | 19.716 | $35K | +262.38% | — | — | 3× cross |
| SOL | Long | $29K | 198.45 | 83.269 | -$40K | -2766.53% | — | — | 20× cross |
| PENDLE | Long | $25K | 3.675 | 1.527 | -$35K | -703.42% | — | — | 5× cross |
| BTC | Long | $20K | 90,396.2 | 73,788 | -$4,586 | -450.16% | — | — | 20× cross |
| SYRUP | Long | $17K | 0.4076 | 0.1299 | -$35K | -641.47% | — | — | 3× cross |
| ENA | Long | $12K | 0.9820 | 0.1437 | -$68K | -5832.73% | — | — | 10× cross |
| REZ | Short | $11K | 0.006522 | 0.003668 | $8,752 | +233.42% | 0.1974 | +5281.41% | 3× cross |
| CC | Long | $5,601 | 0.1716 | 0.09100 | -$4,959 | -265.61% | — | — | 3× cross |
| CELO | Short | $5,213 | 0.1673 | 0.06591 | $8,017 | +461.37% | 7.575 | +11392.62% | 3× cross |
| BLUR | Short | $4,035 | 0.03543 | 0.006498 | $18K | +1335.64% | 0.9629 | +14718.75% | 3× cross |
| SPX | Short | $3,375 | 0.3177 | 0.3572 | -$373 | -55.30% | 67.018 | +18664.23% | 5× cross |
| ZK | Short | $3,294 | 0.05157 | 0.009165 | $15K | +2313.37% | 1.762 | +19123.76% | 5× cross |
| ARB | Short | $3,195 | 0.1414 | 0.1506 | -$195 | -60.96% | 31.252 | +20652.98% | 10× cross |
| MORPHO | Long | $3,141 | 1.276 | 2.003 | $1,141 | +181.63% | — | — | 5× cross |
| NEO | Short | $2,921 | 4.542 | 1.769 | $4,579 | +783.95% | 383.24 | +21566.67% | 5× cross |
| SKY | Long | $2,787 | 0.06294 | 0.05847 | -$213 | -22.97% | — | — | 3× cross |
| JUP | Long | $2,644 | 0.1946 | 0.2573 | $645 | +243.83% | — | — | 10× cross |
| JTO | Long | $2,613 | 1.848 | 0.3220 | -$12K | -2369.57% | — | — | 5× cross |
| ZRO | Long | $2,495 | 1.865 | 1.551 | -$504 | -101.05% | — | — | 5× cross |
| PUMP | Long | $2,097 | 0.002534 | 0.003475 | $568 | +270.79% | — | — | 10× cross |
| TIA | Short | $2,094 | 0.3943 | 0.4129 | -$94 | -22.49% | 130.49 | +31506.99% | 5× cross |
| SUI | Long | $2,067 | 4.519 | 0.8186 | -$9,346 | -4520.56% | — | — | 10× cross |
| ORDI | Short | $2,002 | 3.147 | 3.150 | -$2 | -0.31% | 937.64 | +29662.43% | 3× cross |
| S | Short | $1,970 | 0.05487 | 0.03603 | $1,030 | +261.51% | 11.557 | +31979.34% | 5× cross |
| BIO | Long | $1,959 | 0.07567 | 0.01961 | -$5,599 | -857.67% | — | — | 3× cross |
| STRK | Short | $1,896 | 0.05804 | 0.03668 | $1,104 | +291.17% | 12.224 | +33226.22% | 5× cross |
| APT | Short | $1,751 | 1.597 | 0.5595 | $3,249 | +1855.23% | 211.39 | +37682.02% | 10× cross |
| BNB | Long | $1,668 | 813.71 | 678.57 | -$332 | -199.16% | — | — | 10× cross |
| TRX | Long | $1,663 | 0.2861 | 0.3172 | $163 | +97.95% | — | — | 10× cross |
| POPCAT | Short | $1,650 | 0.05964 | 0.03281 | $1,350 | +245.31% | 11.839 | +35985.52% | 3× cross |
| MERL | Short | $1,532 | 0.05660 | 0.02890 | $1,468 | +287.47% | 11.231 | +38758.13% | 3× cross |
| FARTCOIN | Short | $1,441 | 0.2347 | 0.1127 | $1,559 | +324.61% | 51.744 | +45797.17% | 3× cross |
| SUSHI | Short | $1,253 | 0.3872 | 0.1713 | $1,580 | +378.26% | 81.335 | +47386.46% | 3× cross |
| W | Short | $1,229 | 0.02485 | 0.01018 | $1,771 | +720.53% | 5.228 | +51255.11% | 5× cross |
| NXPC | Long | $1,191 | 0.3801 | 0.1511 | -$1,806 | -454.81% | — | — | 3× cross |
| GMX | Long | $1,182 | 6.381 | 7.546 | $182 | +46.29% | — | — | 3× cross |
| MET | Long | $1,182 | 0.2509 | 0.2967 | $182 | +46.29% | — | — | 3× cross |
| ASTER | Long | $1,131 | 0.5770 | 0.6533 | $132 | +58.39% | — | — | 5× cross |
| EIGEN | Short | $1,125 | 0.2796 | 0.1573 | $875 | +388.75% | 88.214 | +55980.17% | 5× cross |
| BRETT | Short | $1,072 | 0.01025 | 0.003662 | $1,928 | +539.71% | 2.033 | +55408.79% | 3× cross |
| CAKE | Long | $1,067 | 1.696 | 1.810 | $67 | +18.85% | — | — | 3× cross |
| PROVE | Long | $1,039 | 0.3329 | 0.1730 | -$960 | -277.33% | — | — | 3× cross |
| STX | Long | $972 | 0.3141 | 0.3054 | -$28 | -14.16% | — | — | 5× cross |
| VIRTUAL | Short | $807 | 0.6521 | 0.5262 | $193 | +119.68% | 411.30 | +78066.79% | 5× cross |
| POL | Short | $782 | 0.1110 | 0.08683 | $218 | +139.24% | 70.011 | +80529.92% | 5× cross |
| PENGU | Short | $699 | 0.008865 | 0.006198 | $301 | +215.15% | 5.588 | +90050.56% | 5× cross |
| AVNT | Long | $630 | 0.2611 | 0.08230 | -$1,369 | -1086.38% | — | — | 5× cross |
| WIF | Short | $603 | 0.2557 | 0.1542 | $397 | +329.30% | 161.25 | +104484.59% | 5× cross |
| MNT | Long | $551 | 0.7744 | 0.4264 | -$449 | -408.02% | — | — | 5× cross |
| KAITO | Short | $528 | 0.3867 | 0.2043 | $471 | +446.12% | 243.77 | +119198.01% | 5× cross |
| ME | Short | $526 | 0.1620 | 0.04262 | $1,474 | +840.38% | 48.152 | +112879.74% | 3× cross |
| 2Z | Long | $504 | 0.1138 | 0.01912 | -$2,496 | -1485.39% | — | — | 3× cross |
| RESOLV | Long | $449 | 0.08177 | 0.01361 | -$2,251 | -1503.15% | — | — | 3× cross |
| OP | Short | $445 | 0.2175 | 0.09684 | $555 | +623.24% | 143.60 | +148184.78% | 5× cross |
| BERA | Short | $440 | 0.4599 | 0.1012 | $1,560 | +1773.03% | 144.94 | +143177.86% | 5× cross |
| MOVE | Short | $388 | 0.02860 | 0.005545 | $1,612 | +1247.12% | 8.496 | +153122.14% | 3× cross |
| BCH | Long | $319 | 540.54 | 229.89 | -$431 | -1351.31% | — | — | 10× cross |
| WLFI | Long | $311 | 0.1528 | 0.04752 | -$689 | -1107.64% | — | — | 5× cross |
| TRUMP | Long | $267 | 4.204 | 1.123 | -$733 | -2744.06% | — | — | 10× cross |
| TNSR | Short | $3 | 0.1180 | 0.02453 | $12 | +1143.01% | 4,808.7 | +19603441.89% | 3× cross |
| ETH | Short | $0 | 2,856.2 | 2,053.9 | $0 | +781.27% | 6,792,717,689.5 | +330722802.26% | 20× cross |
| COMP | Long | $0 | 72.192 | 19.915 | -$1 | -1312.51% | — | — | 5× cross |
| RENDER | Long | $0 | 6.550 | 1.549 | -$1 | -1613.99% | — | — | 5× cross |
| AVAX | Long | $0 | 31.307 | 8.592 | -$0 | -2643.61% | — | — | 10× cross |
| PYTH | Long | $0 | 0.05376 | 0.06462 | $0 | +84.02% | — | — | 5× cross |
| MON | Long | $0 | 0.01870 | 0.01658 | -$0 | -64.03% | — | — | 5× cross |
| ZORA | Long | $0 | 0.05954 | 0.004751 | -$0 | -3459.82% | — | — | 3× cross |
Recent position changes
last 7 days · sizes at today's markNo recorded position changes in the last 7 days.
Recent trades
latest 50 orders · from HyperliquidLoading trade history…
| Time | Coin | Direction | Size | Price | Notional | Closed PnL | Fee |
|---|
One row is one order: Hyperliquid splits an order into several fills when it trades against several resting orders, so fills of the same order on the same coin within one minute are summed (the fill count is shown after the size). Taker orders are marked. Spot fills are not shown. Read from Hyperliquid's public API when you open this page, at most every 5 minutes.
How to read it. Positions are this wallet's open Hyperliquid perps as recorded at its last check, valued at the available current mark price. Rows without a mark show an explicitly labelled entry-only size fallback, or remain unpriced; their PnL is unavailable. Headline marked exposure excludes entry-only values. PnL coverage also requires an entry price. A cross-margin position's liquidation price moves with the rest of the account, so it can change between checks. Tier B wallets are checked every 15 minutes or so; wallets with bigger positions are checked more often. Not financial advice.
Hyperliquid wallet FAQ
Where does this wallet's data come from?
From Hyperliquid itself. Hyperliquid is an on-chain exchange, so every account's open positions, liquidation prices and account value are public. This site tracks wallets it finds on Hyperliquid's leaderboard and in its trade feed, and records their positions from Hyperliquid's public API. The wallet is identified only by its address; this site doesn't know who owns it.
How often is this wallet checked?
It is in tracking tier B, checked every 15 minutes or so. The tracker checks the 300 wallets with the biggest positions every minute and the rest less often, because Hyperliquid limits how often its API can be called. It was last checked 7 min ago.
What does the PnL show?
The unrealised profit or loss of each open position at Hyperliquid's mark price: size × (mark price − entry price), in the positions table. The PnL history tiles and chart are Hyperliquid's own portfolio history for the whole account over each period, closed trades and unrealised PnL included. The latest recorded account value is $753K.