Derivatives Fear & Greed Index
A daily 0 to 100 reading of the crypto futures market built from four inputs we record ourselves: funding rates, the change in open interest, Binance top traders' long/short positions compared with their 30-day mean, and the balance of liquidations, for Bitcoin and Ether perpetuals. 0 is extreme fear, 100 extreme greed. The formula is published below and never rescales past days.
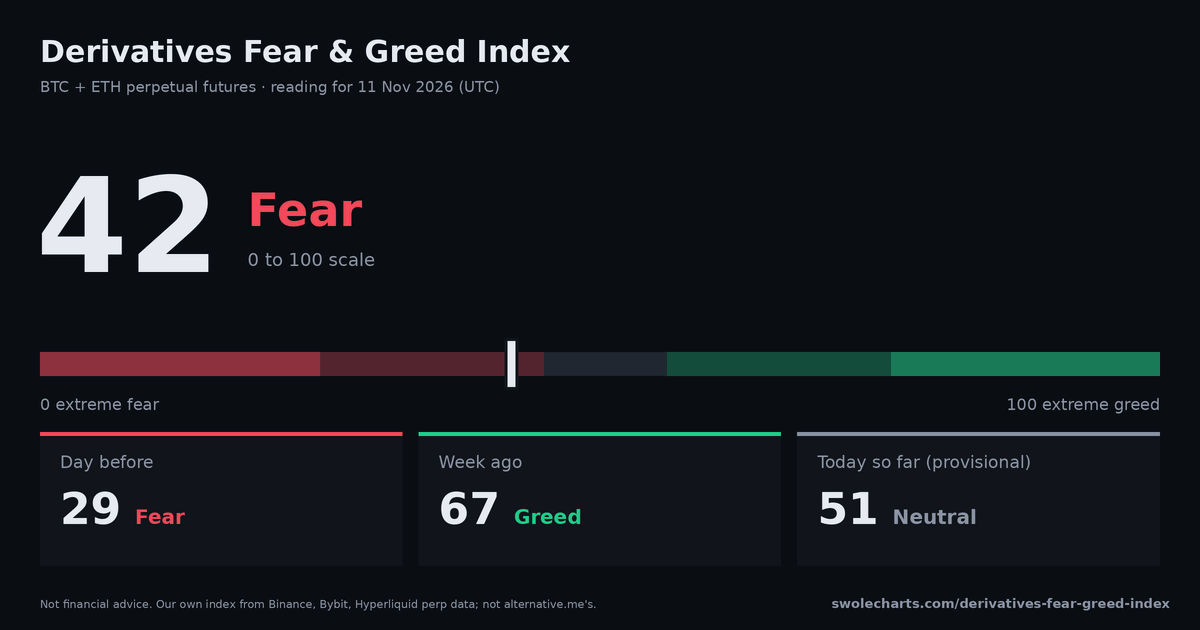
The Derivatives Fear & Greed index was 42 (fear) on 11 Nov 2026 (UTC), from 3 of 4 inputs. The strongest input was oi change at 34. Up from 29 the day before. Today so far: 51 (provisional until the day closes at 00:00 UTC; final by about 02:00 UTC).
Alert me when the daily index closes at an extreme.
Subscribe to the daily index (RSS): one item per settled UTC day, the newest 7, each final at 02:00 UTC the next day; today's provisional reading is left out. No account needed. Feed URL: https://swolecharts.com/derivatives-fear-greed-index/rss.xml
Share: Share on X Telegram Reddit Download the 1200×630 card
Inputs on 11 Nov 2026
each 0–100, 50 = neutral11 Nov 2026 settled mood receipt (vs 10 Nov 2026, UTC): +12.9 index points; liquidations +13.8, oi change -1.1.
Daily history
27 Sep 2026 – 11 Nov 2026 · daily, UTCShaded: extreme greed (above 75, top) and extreme fear (below 25, bottom). The history is short: it starts on the first day this site stored funding, open interest and liquidations (27 Sep 2026, 45 days so far), and grows by one point every UTC day.
Last 30 days
component scores in brackets · JSON| Day (UTC) | Index | Reading | Funding 8h | OI change | Top traders long | Liqs long / short |
|---|---|---|---|---|---|---|
| 2026-11-11 | 42 | Fear | +0.0060% (40) | −1.7% (34) | — vs — (—) | $37.8M / $41.6M (52) |
| 2026-11-10 | 29 | Fear | +0.0057% (39) | −1.3% (37) | — vs — (—) | $293.2M / $36.5M (11) |
| 2026-11-09 | 43 | Fear | +0.0058% (40) | +1.1% (60) | — vs — (—) | $72.5M / $30.7M (30) |
| 2026-11-08 | 20 | Extreme fear | +0.0060% (40) | −4.8% (13) | — vs — (—) | $539.3M / $32.7M (6) |
| 2026-11-07 | 33 | Fear | +0.0058% (40) | −0.6% (44) | — vs — (—) | $9.9M / $1.9M (16) |
| 2026-11-06 | 45 | Neutral | +0.0063% (41) | +1.8% (67) | — vs — (—) | $55.3M / $19.2M (26) |
| 2026-11-05 | 20 | Extreme fear | +0.0080% (45) | −6.4% (7) | — vs 61.8% (—) | $366.6M / $32.3M (8) |
| 2026-11-04 | 67 | Greed | +0.0076% (44) | +3.0% (77) | — vs 61.9% (—) | $101.9M / $391.5M (79) |
| 2026-11-03 | 54 | Neutral | +0.0096% (49) | +1.5% (64) | — vs 61.9% (—) | $33.7M / $31.1M (48) |
| 2026-11-02 | 41 | Fear | +0.0069% (42) | −0.0% (50) | — vs 62.0% (—) | $81.1M / $37.2M (31) |
| 2026-11-01 | 48 | Neutral | +0.0058% (40) | +0.2% (52) | — vs 62.1% (—) | $15.0M / $16.7M (53) |
| 2026-10-31 | 52 | Neutral | +0.0029% (33) | +0.2% (52) | — vs 62.1% (—) | $3.7M / $8.5M (70) |
| 2026-10-30 | 30 | Fear | +0.0026% (32) | −0.9% (41) | — vs 62.2% (—) | $306.7M / $62.7M (17) |
| 2026-10-29 | 27 | Fear | +0.0059% (40) | −2.5% (27) | — vs 62.2% (—) | $406.2M / $64.6M (14) |
| 2026-10-28 | 55 | Neutral | +0.0080% (45) | −0.1% (49) | — vs 62.3% (—) | $21.8M / $54.3M (71) |
| 2026-10-27 | 62 | Greed | +0.0083% (46) | +0.9% (59) | — vs 62.3% (—) | $11.0M / $45.4M (81) |
| 2026-10-26 | 48 | Neutral | +0.0072% (43) | +1.5% (65) | — vs 62.4% (—) | $41.0M / $22.5M (35) |
| 2026-10-25 | 41 | Fear | +0.0063% (41) | −1.4% (36) | 63.0% vs 62.3% (58) | $31.3M / $13.6M (30) |
| 2026-10-24 | 36 | Fear | +0.0046% (37) | −0.4% (46) | 62.4% vs 62.4% (50) | $240.3M / $29.1M (11) |
| 2026-10-23 | 34 | Fear | +0.0067% (42) | −1.3% (37) | 61.5% vs 62.3% (41) | $107.1M / $19.8M (16) |
| 2026-10-22 | 25 | Fear | +0.0035% (34) | −2.5% (27) | 60.8% vs 62.3% (32) | $142.1M / $8.7M (6) |
| 2026-10-21 | 65 | Greed | +0.0062% (41) | +3.4% (79) | 63.0% vs 62.2% (61) | $21.4M / $85.1M (80) |
| 2026-10-20 | 55 | Neutral | +0.0067% (42) | +1.0% (60) | 63.3% vs 62.1% (65) | $55.1M / $61.3M (53) |
| 2026-10-19 | 60 | Greed | +0.0080% (45) | +1.0% (60) | 63.1% vs 62.0% (63) | $20.6M / $48.9M (70) |
| 2026-10-18 | 47 | Neutral | +0.0054% (39) | +0.0% (50) | 62.9% vs 62.0% (62) | $64.1M / $39.9M (38) |
| 2026-10-17 | 40 | Fear | +0.0055% (39) | −0.6% (44) | 63.2% vs 61.9% (65) | $67.1M / $7.5M (10) |
| 2026-10-16 | 42 | Fear | +0.0062% (41) | −0.3% (47) | 60.9% vs 62.0% (36) | $66.8M / $52.2M (44) |
| 2026-10-15 | 28 | Fear | +0.0052% (38) | −1.1% (39) | 58.9% vs 62.2% (16) | $201.6M / $50.0M (20) |
| 2026-10-14 | 36 | Fear | +0.0027% (33) | +0.8% (58) | 60.6% vs 62.1% (32) | $77.4M / $20.8M (21) |
| 2026-10-13 | 41 | Fear | +0.0042% (36) | +0.7% (57) | 61.2% vs 62.1% (38) | $55.4M / $28.7M (34) |
Settled bands: runs and next-day transitions
formula v1Settled days 27 Sep 2026 to 11 Nov 2026: 45 readings, 43 adjacent-day pairs. Only closed days past 02:00 UTC with a value count; a missing day breaks a run and counts as no transition. These are past observations, not forecasts.
| From \ to next day | Extreme fear | Fear | Neutral | Greed | Extreme greed | Pairs |
|---|---|---|---|---|---|---|
| Extreme fear | 0 (0%) | 1 (50%) | 1 (50%) | 0 (0%) | 0 (0%) | 2 |
| Fear | 1 (6%) | 11 (65%) | 5 (29%) | 0 (0%) | 0 (0%) | 17 |
| Neutral | 0 (0%) | 5 (31%) | 4 (25%) | 7 (44%) | 0 (0%) | 16 |
| Greed | 1 (12%) | 2 (25%) | 4 (50%) | 1 (12%) | 0 (0%) | 8 |
| Extreme greed | — | — | — | — | — | 0 |
| Band | Longest observed run | Longest span | Most recent run | Most recent span |
|---|---|---|---|---|
| Extreme fear | 1 day | 8 Nov 2026 | 1 day | 8 Nov 2026 |
| Fear | 6 days | 12 Oct 2026 – 17 Oct 2026 | 3 days | 9 Nov 2026 – 11 Nov 2026 (censored at end) |
| Neutral | 4 days | 27 Sep 2026 – 30 Sep 2026 (censored at start) | 1 day | 6 Nov 2026 |
| Greed | 2 days | 1 Oct 2026 – 2 Oct 2026 | 1 day | 4 Nov 2026 |
| Extreme greed | — | — | — | — |
Methodology
formula v1Each UTC day we compute four scores from the BTC and ETH perpetual futures of every exchange this site tracks. Each maps its input to 0–100 with a fixed scale, so 50 is neutral, and the index is their plain average (at least 3 of the 4 must be available that day).
- Funding: F = the day's open-interest-weighted average funding rate, per 8 hours. Score = 50 + 50 × tanh((F − 0.01%) / 0.02%). 0.01% per 8 h is the rate most exchanges pay when longs and shorts are balanced; 0.03% scores 88, 0% scores 27.
- Open interest change: Δ = BTC + ETH open interest in USD at the end of the day over the end of the day before, minus 1. Score = 50 + 50 × tanh(Δ / 5%). New leverage flowing in reads as greed, positions closing as fear. Because open interest is measured in USD, it also moves with the price: a 5% rally with no new positions reads as +5%.
- Long/short: P = Binance top traders' long share of their positions (BTC and ETH averaged), compared with its own mean over the previous 30 days. Score = 50 + 50 × tanh((P − 30-day mean) / 4 percentage points). Positions rather than account counts, because the crowd's account ratio tends to rise when prices fall.
- Liquidations: Score = 100 × short liquidations / (long + short liquidations), in USD. Shorts are wiped out when the price rises, longs when it falls.
Readings: 0–24 extreme fear, 25–44 fear, 45–55 neutral, 56–75 greed, 76–100 extreme greed (on the rounded value). Today's value is provisional until the day closes at 00:00 UTC. The day that just closed can still shift slightly until about 02:00 UTC, when the hourly rollups replace the 5-minute data it was read from; after that it does not change. Liquidation feeds sample (Binance publishes at most one liquidation per symbol per second), so the liquidation score uses the long/short balance, not the size. All data comes from the exchanges' public APIs.
The history is short, so there is not enough of it to say what any reading has led to. The index describes positioning that already happened; it is not a trading signal and not financial advice.
This index is our own. It is not affiliated with CNN's Fear & Greed Index or alternative.me's Crypto Fear & Greed Index, and uses none of their data. Formula version 1.
Derivatives Fear & Greed FAQ
What is the Derivatives Fear & Greed index?
A daily number from 0 (extreme fear) to 100 (extreme greed) that sums up how traders are positioned in Bitcoin and Ether perpetual futures. It averages four scores: funding rates, the day's change in open interest (in USD), Binance top traders' long/short positions compared with their 30-day mean, and the long/short balance of liquidations. Each score is 50 when its input is neutral. Readings: 0–24 extreme fear, 25–44 fear, 45–55 neutral, 56–75 greed, 76–100 extreme greed.
How is it different from the classic crypto Fear & Greed index?
This index is our own. It is not affiliated with CNN's Fear & Greed Index or alternative.me's Crypto Fear & Greed Index, and uses none of their data. The classic index mixes spot volatility, volume, social media and search trends; its daily values and history are on a separate page, credited to alternative.me. This one uses only futures-market data that this site records from the exchanges' public APIs, so every input can be checked on our funding, open interest, long/short and liquidation pages.
Can past values change?
Not after they settle. The scales are fixed numbers, not rescaled to a trailing window, so new days never rescale old ones. Today's reading moves until the day closes at 00:00 UTC and is marked provisional; the day that just closed can still shift slightly until about 02:00 UTC, when the hourly rollups replace the 5-minute data it was first read from. After that it is fixed. If the formula is ever changed, the version number (now 1) in the API and on this page changes with it.
How can I cite or use it?
Cite it as "swolecharts Derivatives Fear & Greed index" with the date and a link to this page. The daily values, with every input and component score, are free as JSON at /api/derivatives-fear-greed.
Is it a trading signal?
No. It describes positioning that already happened and makes no prediction. The history is short, so there is not enough of it to say what any reading has led to. Extreme readings can last for weeks. The liquidations page shows what is happening now. Nothing here is financial advice.