Bybit Open Interest, Volume and Funding Rates
Live Bybit derivatives data from its public API: total open interest and its share of all exchanges tracked here, 24h volume, OI-weighted funding, 24h liquidations and the largest markets by open interest. See the Bybit funding rate history FAQ for recorded BTC/ETH rates and coverage.
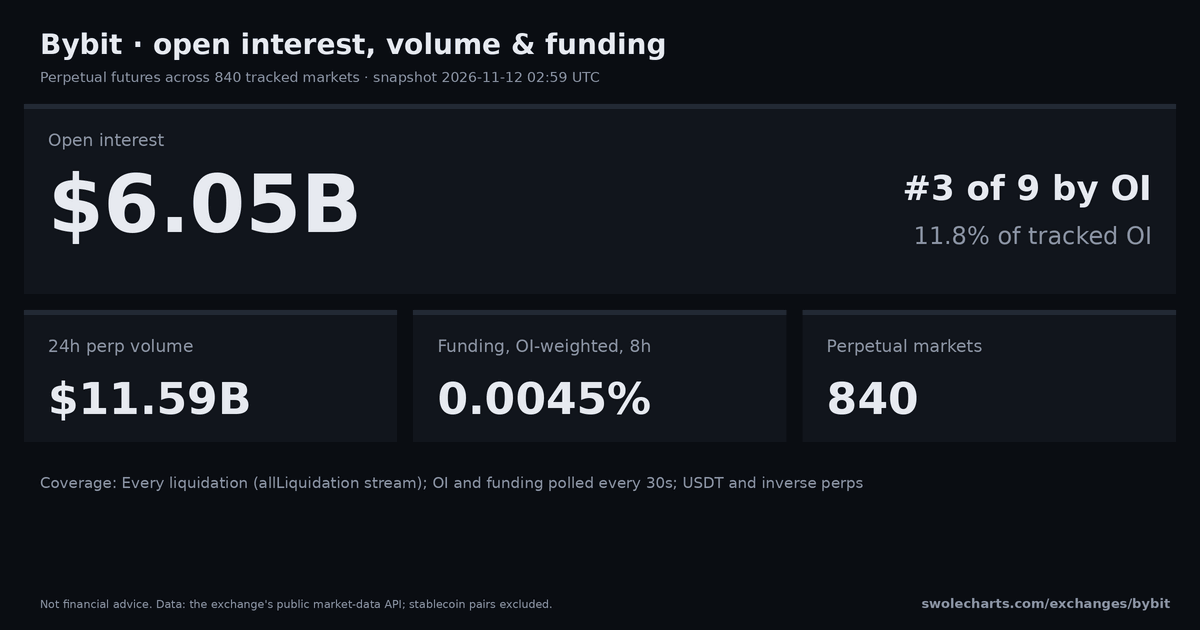
Bybit has $6.06B of perpetual open interest across 840 markets, 11.8% of the total across the 9 exchanges tracked here (#3). BTC is its largest market at $2.51B (41.5% of Bybit OI), and OI-weighted funding is 0.0044% per 8h (494 of 598 markets with nonzero funding have longs paying shorts). Funding coverage: 242 flat · 0 no data. The biggest 24h open interest move among markets with at least $1M OI is OPG (OPGUSDT): +61.19%. $25.05M of positions were liquidated over the last 24 hours, 60.1% of it longs.
Share: Share on X Telegram Reddit Download the 1200×630 card
Top Bybit markets by open interest
top 50 of 840 perps| # | Market | Price | Open interest | Share | OI 1h | OI 24h | Funding / 8h | Vol 24h | Trade |
|---|---|---|---|---|---|---|---|---|---|
| 1 | BTC BTCUSDT | 73,826.6 | $2.51B | 41.5% | +0.14% | -2.16% | 0.0084% | $3.83B | Trade ↗ |
| 2 | ETH ETHUSDT | 2,058.2 | $753.03M | 12.4% | +1.01% | +0.28% | 0.0073% | $1.76B | Trade ↗ |
| 3 | BTC BTCUSD | 73,748.1 | $400.75M | 6.6% | +0.04% | +2.00% | 0.0100% | $133.14M | Trade ↗ |
| 4 | SOL SOLUSDT | 83.390 | $257.93M | 4.3% | +0.46% | +1.13% | -0.0044% | $396.22M | Trade ↗ |
| 5 | XRP XRPUSDT | 1.052 | $131.25M | 2.2% | +0.17% | +2.12% | 0.0100% | $295.14M | Trade ↗ |
| 6 | HYPE HYPEUSDT | 72.142 | $113.10M | 1.9% | +0.30% | +0.18% | 0.0100% | $156.78M | Trade ↗ |
| 7 | ZEC ZECUSDT | 993.82 | $80.32M | 1.3% | +2.03% | -9.48% | 0.0100% | $525.89M | Trade ↗ |
| 8 | XAUT XAUTUSDT | 3,974.8 | $71.34M | 1.2% | +0.02% | -1.80% | 0.0100% | $27.52M | Trade ↗ |
| 9 | ETH ETHUSD | 2,055.2 | $66.01M | 1.1% | -0.01% | -1.52% | 0.0100% | $28.59M | Trade ↗ |
| 10 | XAU XAUUSDT | 3,988.5 | $65.05M | 1.1% | -0.08% | +7.62% | 0.0000% | $141.22M | Trade ↗ |
| 11 | NEAR NEARUSDT | 3.571 | $53.16M | 0.9% | +0.37% | -3.65% | -0.0266% | $166.23M | Trade ↗ |
| 12 | DOGE DOGEUSDT | 0.06756 | $45.63M | 0.8% | +0.32% | -3.06% | -0.0061% | $52.54M | Trade ↗ |
| 13 | BNB BNBUSDT | 680.10 | $44.93M | 0.7% | +0.45% | -0.35% | -0.0006% | $15.82M | Trade ↗ |
| 14 | NVDA NVDAUSDT | 162.70 | $39.49M | 0.7% | +1.65% | +8.52% | 0.0775% | $239.61M | Trade ↗ |
| 15 | AVAX AVAXUSDT | 8.602 | $30.69M | 0.5% | +1.51% | +2.36% | 0.0007% | $32.96M | Trade ↗ |
| 16 | SUI SUIUSDT | 0.8223 | $30.41M | 0.5% | +0.80% | -3.65% | -0.0028% | $35.90M | Trade ↗ |
| 17 | TRX TRXUSDT | 0.3171 | $29.85M | 0.5% | -0.11% | +0.25% | -0.0035% | $5.60M | Trade ↗ |
| 18 | SOXL SOXLUSDT | 63.820 | $29.41M | 0.5% | +2.88% | -19.74% | 0.0000% | $886.19M | Trade ↗ |
| 19 | LIT LITUSDT | 3.273 | $29.26M | 0.5% | +0.19% | -5.49% | 0.0100% | $23.35M | Trade ↗ |
| 20 | LINK LINKUSDT | 10.174 | $29.24M | 0.5% | +0.61% | -1.57% | 0.0025% | $23.82M | Trade ↗ |
| 21 | LTC LTCUSDT | 49.990 | $26.67M | 0.4% | +0.18% | -0.61% | -0.0059% | $13.21M | Trade ↗ |
| 22 | PEPE 1000PEPEUSDT | 0.0000046030 | $26.30M | 0.4% | -0.52% | -18.83% | -0.0136% | $153.59M | Trade ↗ |
| 23 | SPCX SPCXUSDT | 139.96 | $24.08M | 0.4% | +1.34% | +0.91% | 0.0000% | $76.66M | Trade ↗ |
| 24 | UNI UNIUSDT | 6.226 | $23.81M | 0.4% | +1.86% | -3.27% | 0.0100% | $39.56M | Trade ↗ |
| 25 | ENA ENAUSDT | 0.1449 | $22.75M | 0.4% | -0.06% | -7.85% | 0.0100% | $54.30M | Trade ↗ |
| 26 | ADA ADAUSDT | 0.1740 | $22.71M | 0.4% | +0.29% | -1.54% | -0.0040% | $33.70M | Trade ↗ |
| 27 | ASTER ASTERUSDT | 0.6560 | $22.41M | 0.4% | -0.13% | -2.17% | -0.0039% | $7.13M | Trade ↗ |
| 28 | XMR XMRUSDT | 573.91 | $22.36M | 0.4% | +0.15% | -2.27% | 0.0275% | $27.47M | Trade ↗ |
| 29 | XAG XAGUSDT | 51.620 | $22.28M | 0.4% | +0.21% | -4.66% | 0.0000% | $43.89M | Trade ↗ |
| 30 | AAVE AAVEUSDT | 118.79 | $21.22M | 0.4% | +0.87% | -3.64% | 0.0080% | $28.74M | Trade ↗ |
| 31 | ONDO ONDOUSDT | 0.3580 | $19.75M | 0.3% | -0.01% | -6.40% | 0.0100% | $20.88M | Trade ↗ |
| 32 | WLD WLDUSDT | 0.3073 | $19.48M | 0.3% | +0.51% | +0.68% | -0.0024% | $23.60M | Trade ↗ |
| 33 | GOOGL GOOGLUSDT | 295.47 | $18.70M | 0.3% | -0.06% | -1.15% | 0.0000% | $21.71M | Trade ↗ |
| 34 | SNDK SNDKUSDT | 969.05 | $16.47M | 0.3% | +3.31% | -23.71% | 0.0046% | $147.58M | Trade ↗ |
| 35 | XRP XRPUSD | 1.051 | $16.29M | 0.3% | -0.14% | -1.13% | 0.0100% | $7.15M | Trade ↗ |
| 36 | PUMPFUN PUMPFUNUSDT | 0.003489 | $15.54M | 0.3% | +0.38% | -0.15% | 0.0100% | $36.53M | Trade ↗ |
| 37 | INTC INTCUSDT | 61.360 | $15.38M | 0.3% | -0.45% | -20.43% | 0.0000% | $37.60M | Trade ↗ |
| 38 | CL CLUSDT | 84.900 | $15.17M | 0.3% | +0.40% | -8.44% | -0.0252% | $59.68M | Trade ↗ |
| 39 | TAO TAOUSDT | 215.66 | $15.11M | 0.2% | +0.12% | -2.29% | 0.0100% | $17.42M | Trade ↗ |
| 40 | MNT MNTUSDT | 0.4277 | $14.88M | 0.2% | +0.51% | +0.57% | 0.0100% | $6.07M | Trade ↗ |
| 41 | MU MUUSDT | 800.81 | $14.05M | 0.2% | +0.13% | +5.18% | 0.0000% | $75.51M | Trade ↗ |
| 42 | QQQ QQQUSDT | 686.75 | $14.02M | 0.2% | -0.32% | +8.56% | 0.0000% | $32.67M | Trade ↗ |
| 43 | XLM XLMUSDT | 0.1474 | $14.01M | 0.2% | +0.69% | +1.09% | -0.0192% | $16.44M | Trade ↗ |
| 44 | BCH BCHUSDT | 229.53 | $13.84M | 0.2% | +0.66% | -0.99% | 0.0083% | $8.84M | Trade ↗ |
| 45 | SKHYNIX SKHYNIXUSDT | 972.16 | $13.77M | 0.2% | +0.12% | -12.26% | 0.0000% | $50.80M | Trade ↗ |
| 46 | GRAM GRAMUSDT | 1.191 | $13.24M | 0.2% | +0.81% | +7.84% | 0.0100% | $43.01M | Trade ↗ |
| 47 | ZRO ZROUSDT | 1.556 | $12.34M | 0.2% | +0.15% | -0.23% | 0.0100% | $15.05M | Trade ↗ |
| 48 | PAXG PAXGUSDT | 3,976.5 | $12.16M | 0.2% | +0.38% | +1.48% | 0.0100% | $3.65M | Trade ↗ |
| 49 | MSTR MSTRUSDT | 120.14 | $12.12M | 0.2% | -0.07% | -17.62% | 0.0005% | $31.38M | Trade ↗ |
| 50 | HBAR HBARUSDT | 0.06563 | $11.01M | 0.2% | +0.86% | -6.46% | -0.0092% | $8.84M | Trade ↗ |
- Open interest
- Bybit open interest, USD (left)
- share of all exchanges tracked (right)
- Perp volume (24h)
- Bybit 24h perp volume, USD (left)
- share of all exchanges tracked (right)
Daily numbers (46 UTC days, newest first)
| Date | OI | OI share | Volume | Vol share |
|---|---|---|---|---|
| $6.05B | 11.8% | $11.86B | 13.4% | |
| $6.15B | 11.8% | $11.75B | 13.5% | |
| $6.16B | 11.8% | $15.06B | 13.4% | |
| $6.23B | 11.8% | $14.35B | 13.2% | |
| $6.42B | 11.8% | $9.29B | 13.9% | |
| $6.45B | 11.7% | $3.75B | 11.5% | |
| $6.45B | 11.7% | $13.10B | 13.7% | |
| $6.61B | 11.7% | $22.28B | 14.0% | |
| $6.68B | 11.7% | $21.14B | 13.4% | |
| $6.52B | 11.6% | $10.45B | 13.5% | |
| $6.56B | 11.8% | $11.43B | 12.5% | |
| $6.60B | 11.8% | $5.06B | 11.9% | |
| $6.58B | 11.8% | $5.04B | 12.7% | |
| $6.51B | 11.7% | $18.93B | 13.4% | |
| $6.47B | 11.2% | $23.34B | 13.8% | |
| $6.48B | 11.1% | $11.99B | 13.6% | |
| $6.47B | 11.2% | $10.49B | 13.7% | |
| $6.34B | 11.2% | $11.75B | 12.6% | |
| $6.40B | 11.3% | $7.03B | 12.6% | |
| $6.44B | 11.3% | $9.88B | 12.3% | |
| $6.53B | 11.3% | $11.47B | 13.1% | |
| $6.50B | 11.2% | $14.64B | 13.1% | |
| $6.71B | 11.2% | $13.87B | 13.2% | |
| $6.44B | 11.2% | $13.43B | 12.9% | |
| $6.31B | 11.0% | $10.65B | 12.2% | |
| $6.26B | 11.1% | $9.22B | 12.3% | |
| $6.34B | 11.1% | $6.01B | 12.2% | |
| $6.42B | 11.1% | $12.86B | 12.7% | |
| $6.41B | 11.2% | $19.06B | 13.2% | |
| $6.37B | 11.0% | $15.51B | 13.5% | |
| $6.34B | 10.8% | $14.80B | 13.4% | |
| $6.54B | 10.9% | $14.57B | 13.5% | |
| $6.54B | 10.9% | $7.45B | 12.6% | |
| $6.50B | 10.9% | $5.11B | 12.1% | |
| $6.49B | 11.0% | $10.80B | 13.2% | |
| $6.85B | 10.9% | $15.81B | 13.6% | |
| $6.99B | 10.9% | $11.19B | 13.4% | |
| $6.99B | 10.9% | $13.48B | 13.2% | |
| $6.88B | 10.8% | $7.21B | 13.0% | |
| $6.79B | 10.8% | $5.43B | 12.7% | |
| $7.03B | 11.0% | $20.61B | 14.0% | |
| $6.83B | 11.4% | $15.24B | 16.0% | |
| $6.82B | 11.5% | $16.68B | 15.5% | |
| $6.85B | 11.6% | $14.73B | 15.2% | |
| $6.89B | 11.7% | $18.02B | 16.0% | |
| $6.70B | 11.8% | $9.18B | 15.6% |
Coverage. Every liquidation (allLiquidation stream); OI and funding polled every 30s; USDT and inverse perps. Markets: spot + perp.
How it's counted. Open interest is the USD value of open perpetual positions (one side) at the mark price, summed over the Bybit markets this site tracks; stablecoin pairs are left out. Funding is the 8-hour equivalent, weighted by each market's open interest. OI changes come from 5-minute snapshots this site records and show "—" until that much history exists.
Bybit FAQ
How much open interest is on Bybit?
The total at the top of this page is the USD value of open Bybit perpetual futures positions, summed over every market this site tracks and valued at the current mark price. It refreshes with every page load.
What is Bybit's OI-weighted funding rate?
The average funding across Bybit's perps, weighted by each market's open interest and shown per 8 hours. Positive means longs pay shorts on balance. See every market's rate in the table or on funding rates.
Where can I see Bybit funding rate history?
Over the last seven completed UTC days, 2026-11-05 to 2026-11-11: BTC mean 0.0069%/8h (168 observed hours out of 168); ETH mean 0.0043%/8h (168 observed hours out of 168). These are recorded rate observations, not settled payments; coverage applies to BTC and ETH only, not every perpetual market. See Bybit funding rate history. See Bybit funding rates now.
Does this page show Bybit liquidations?
Yes: this page shows Bybit liquidations over the last 24 hours, split into longs and shorts. Coverage: Every liquidation (allLiquidation stream); OI and funding polled every 30s; USDT and inverse perps.
Where does the data come from?
Bybit's public market-data API, read live by this site. Nothing here comes from paid data vendors.