Swolecharts
Live crypto data · 10 exchanges
Log inSign up

Lighter Open Interest, Volume and Funding Rates

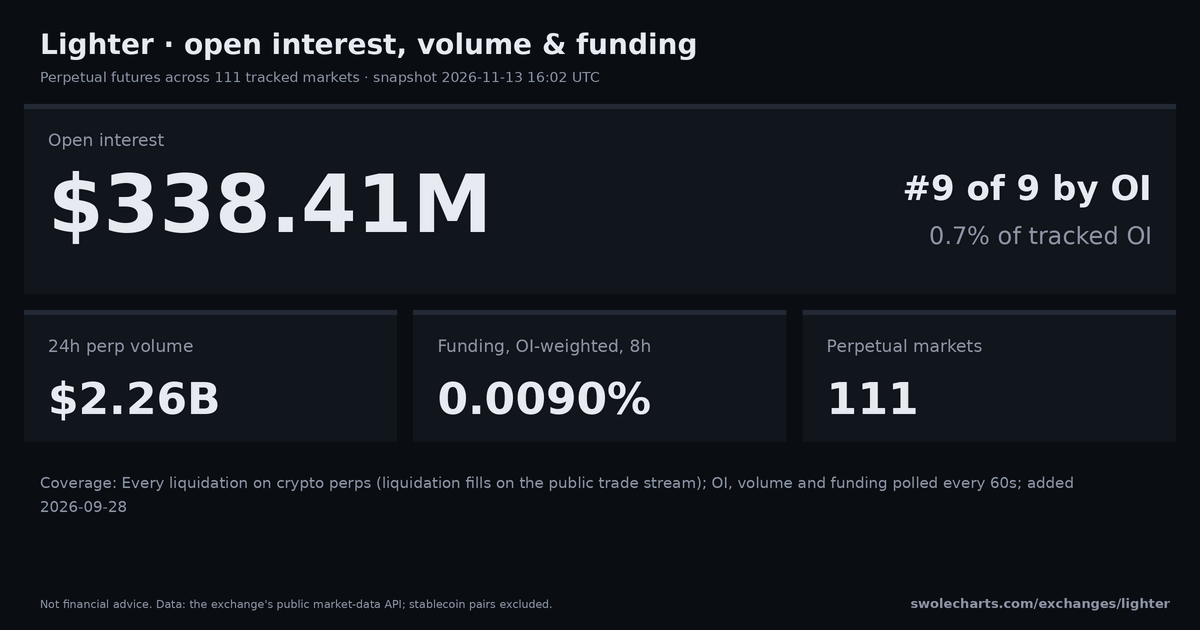
Live Lighter derivatives data from its public API: total open interest and its share of all exchanges tracked here, 24h volume, OI-weighted funding, 24h liquidations and the largest markets by open interest. See the Lighter funding rate history FAQ for recorded BTC/ETH rates and coverage.

Lighter has $340.83M of perpetual open interest across 111 markets, 0.7% of the total across the 9 exchanges tracked here (#9). BTC is its largest market at $131.76M (38.7% of Lighter OI), and OI-weighted funding is 0.0082% per 8h (99 of 108 markets with nonzero funding have longs paying shorts). Funding coverage: 3 flat · 0 no data. The biggest 24h open interest move among markets with at least $1M OI is ENA (ENA): -19.97%. $10.00M of positions were liquidated over the last 24 hours, 94.6% of it longs.

111 perps#9 of 9 by OIAs of 15:50 UTC

Share: Share on X Telegram Reddit Download the 1200×630 card

Open interest#9 of 9
$340.83M
0.7% of all exchanges tracked
OI change24h
-4.70%
over 24 hours
Volume24h
$2.38B
perps
Funding, OI-weighted8h
0.0082%
≈9% APR99 ▲ · 9 ▼3 flat · 0 no data
Markets
111
111 perps

Lighter liquidations · last 24 hours

Lighter history → All liquidations →
Total
$10.00M
2559 liquidations
Longs
$9.45M
94.6%
Shorts
$544K
5.4%

Top Lighter markets by open interest

top 50 of 111 perps
# Market Price Open interest Share OI 1h OI 24h Funding / 8h Vol 24h Trade
1BTC BTC68,759.8$131.76M38.7%-3.08%-12.99%0.0096%$1.44BTrade ↗
2ETH ETH1,936.7$74.77M21.9%+9.07%+8.13%0.0096%$655.97MTrade ↗
3LIT LIT3.231$34.83M10.2%-3.40%-1.59%0.0096%$16.76MTrade ↗
4HYPE HYPE72.919$21.55M6.3%+1.04%+4.57%0.0096%$81.56MTrade ↗
5ZEC ZEC948.34$9.76M2.9%-3.35%-8.52%0.0096%$59.16MTrade ↗
6SOL SOL80.000$9.74M2.9%-1.03%-10.04%0.0072%$59.51MTrade ↗
7ZRO ZRO1.582$5.16M1.5%-0.20%+6.94%0.0096%$1.17MTrade ↗
8NEAR NEAR3.511$4.99M1.5%-0.99%+2.22%0.0096%$6.44MTrade ↗
9AAVE AAVE111.96$3.98M1.2%-1.69%-3.51%0.0096%$1.02MTrade ↗
10XMR XMR530.49$3.50M1.0%-1.45%-14.13%-0.0432%$7.81MTrade ↗
11AVAX AVAX8.418$3.03M0.9%-0.79%-1.01%-0.0016%$1.26MTrade ↗
12BNB BNB633.55$2.99M0.9%-1.50%-7.40%0.0056%$7.04MTrade ↗
13WLD WLD0.2969$2.60M0.8%-2.19%+3.08%-0.0192%$2.04MTrade ↗
14PUMP PUMP0.003462$2.30M0.7%-0.98%-0.64%0.0096%$1.16MTrade ↗
15PAXG PAXG3,873.2$1.68M0.5%+0.20%+8.78%0.0096%$679KTrade ↗
16XRP XRP1.021$1.62M0.5%-7.64%-9.64%0.0096%$8.20MTrade ↗
17ADA ADA0.1714$1.54M0.5%-0.93%-1.64%0.0096%$289KTrade ↗
18LINK LINK9.910$1.39M0.4%-1.94%+2.76%0.0096%$1.56MTrade ↗
19ENA ENA0.1370$1.37M0.4%-1.80%-19.97%0.0096%$2.24MTrade ↗
20GRAM GRAM1.120$1.33M0.4%-4.79%-15.32%-0.0384%$2.74MTrade ↗
21WLFI WLFI0.04757$954K0.3%-0.45%-8.86%0.0000%$262KTrade ↗
22SUI SUI0.8098$886K0.3%-1.50%-0.87%0.0096%$890KTrade ↗
23VVV VVV19.015$870K0.3%-2.38%-2.10%0.0096%$1.52MTrade ↗
24XPL XPL0.04999$803K0.2%-1.04%+0.64%0.0096%$301KTrade ↗
25LDO LDO0.3022$734K0.2%-1.64%+0.54%0.0096%$98KTrade ↗
26UNI UNI5.823$722K0.2%-0.82%-8.08%0.0096%$1.53MTrade ↗
27ASTER ASTER0.6606$660K0.2%-0.92%-1.12%0.0016%$71KTrade ↗
28AERO AERO0.4774$638K0.2%-1.32%-6.59%0.0096%$481KTrade ↗
29USELESS USELESS0.1302$612K0.2%-2.83%+14.87%0.0096%$168KTrade ↗
30MEGA MEGA0.04607$595K0.2%-1.96%-3.87%0.0096%$70KTrade ↗
31GRASS GRASS0.4303$583K0.2%-1.36%-2.42%0.0096%$82KTrade ↗
32LTC LTC49.210$561K0.2%-1.78%-24.07%-0.0304%$881KTrade ↗
33DOGE DOGE0.06503$530K0.2%-1.44%+2.90%0.0096%$941KTrade ↗
34ETHFI ETHFI0.5743$525K0.2%-2.08%-9.45%-0.0456%$696KTrade ↗
35CRV CRV0.2315$516K0.2%-1.55%+12.38%0.0096%$200KTrade ↗
36TAO TAO213.24$512K0.2%-1.01%+2.60%0.0096%$365KTrade ↗
37ARB ARB0.1475$456K0.1%-2.16%-0.74%0.0096%$730KTrade ↗
38BCH BCH224.48$423K0.1%-0.63%+10.36%0.0000%$422KTrade ↗
39MON MON0.01645$413K0.1%+0.41%-5.14%0.0096%$461KTrade ↗
40JUP JUP0.2610$406K0.1%+1.99%+9.28%0.0096%$302KTrade ↗
41ONDO ONDO0.3431$391K0.1%-0.98%-14.82%0.0096%$376KTrade ↗
42MORPHO MORPHO1.980$369K0.1%-1.17%+7.00%0.0096%$180KTrade ↗
43PONS PONS0.1457$361K0.1%-2.06%-4.05%0.0096%$384KTrade ↗
44ICP ICP2.627$352K0.1%-1.06%+74.58%0.0096%$776KTrade ↗
45PEPE 1000PEPE0.0000045130$321K0.1%-5.18%-6.88%0.0096%$530KTrade ↗
46EIGEN EIGEN0.1551$306K0.1%-0.94%+1.76%0.0096%$15KTrade ↗
47POL POL0.08707$293K0.1%-0.11%-5.74%0.0096%$117KTrade ↗
48PENDLE PENDLE1.549$291K0.1%-0.61%-1.54%-0.0264%$288KTrade ↗
49VIRTUAL VIRTUAL0.5175$278K0.1%-0.97%-10.95%0.0096%$134KTrade ↗
50APT APT0.5427$263K0.1%+0.54%-0.87%0.0088%$237KTrade ↗

Lighter open interest and volume history

29 Sep 2026 – 13 Nov 2026 · UTC days All exchanges' share →
  • Open interest
  • Lighter open interest, USD (left)
  • share of all exchanges tracked (right)
Area chart of Lighter's daily open interest in US dollars with a line for its share of all exchanges tracked, 29 Sep 2026 to 13 Nov 2026. $0 0.0% $150M 0.2% $300M 0.5% $450M 0.8% $600M 1.0% 5 Oct 12 Oct 19 Oct 26 Oct 2 Nov 9 Nov
  • Perp volume (24h)
  • Lighter 24h perp volume, USD (left)
  • share of all exchanges tracked (right)
Area chart of Lighter's daily 24h perp volume in US dollars with a line for its share of all exchanges tracked, 29 Sep 2026 to 13 Nov 2026. $0 0% $1B 1% $2B 2% $3B 3% $4B 4% 5 Oct 12 Oct 19 Oct 26 Oct 2 Nov 9 Nov
Daily numbers (45 UTC days, newest first)
DateOIOI shareVolumeVol share
$339.21M0.7%$2.53B1.8%
$358.33M0.7%$1.79B1.9%
$365.14M0.7%$1.59B1.8%
$374.69M0.7%$2.25B2.0%
$386.36M0.7%$2.19B2.0%
$386.84M0.7%$1.19B1.8%
$392.83M0.7%$791.00M2.4%
$394.43M0.7%$1.62B1.7%
$410.15M0.7%$2.67B1.7%
$408.28M0.7%$2.40B1.5%
$401.71M0.7%$1.56B2.0%
$398.65M0.7%$1.94B2.1%
$396.03M0.7%$828.65M2.0%
$389.13M0.7%$825.33M2.1%
$390.65M0.7%$1.96B1.4%
$403.38M0.7%$2.59B1.5%
$410.65M0.7%$1.31B1.5%
$412.41M0.7%$1.45B1.9%
$411.68M0.7%$1.66B1.8%
$405.65M0.7%$1.01B1.8%
$408.36M0.7%$1.32B1.6%
$432.03M0.7%$1.18B1.4%
$445.19M0.8%$1.91B1.7%
$457.64M0.8%$1.50B1.4%
$433.19M0.8%$1.84B1.8%
$429.29M0.8%$1.64B1.9%
$411.16M0.7%$1.51B2.0%
$418.53M0.7%$806.81M1.6%
$423.61M0.7%$1.64B1.6%
$406.52M0.7%$1.76B1.2%
$417.12M0.7%$1.71B1.5%
$426.43M0.7%$1.50B1.4%
$455.32M0.8%$1.43B1.3%
$457.02M0.8%$1.04B1.7%
$478.16M0.8%$910.66M2.2%
$479.53M0.8%$1.38B1.7%
$489.00M0.8%$1.94B1.7%
$495.34M0.8%$1.42B1.7%
$491.61M0.8%$1.29B1.3%
$482.86M0.8%$679.01M1.2%
$469.13M0.7%$458.99M1.1%
$482.04M0.8%$1.46B1.0%
$482.91M0.8%$1.24B1.3%
$487.18M0.8%$1.44B1.3%
$496.19M0.8%$1.42B1.5%

Lighter funding, open-interest and liquidation API

Download BTC history using these anonymous Swolecharts read endpoints for data collected from Lighter's public market-data feeds. Open a JSON link below or use its URL in a spreadsheet or script. These are not Lighter trading or order APIs.

BTC funding JSON · 7 days, hourly

/api/series/funding?base=BTC&venue=lighter&range=7d&step=1h

Source: market_1h. v is the OI-weighted funding rate as a decimal fraction normalized to eight hours: 0.0001 means 0.01% per 8h. These are observed quotes, not a settled payment ledger.

Example fields (illustrative values): {"t": [1792886400000], "v": [0.0001]}

BTC open-interest JSON · 1 day, hourly

/api/series/oi?base=BTC&venue=lighter&range=1d&step=1h

Source: market_1h. v is open interest in USD notional; 1000000 means $1,000,000 of open positions.

Example fields (illustrative values): {"t": [1792886400000], "v": [1000000]}

BTC liquidation JSON · 1 day, hourly

/api/series/liquidations?base=BTC&venue=lighter&range=1d&step=1h

Source: liquidations. long and short are observed liquidated USD notional per bucket: $1,500 of longs and $500 of shorts in this example. These are observed liquidations, not modeled heatmap levels.

Example fields (illustrative values): {"t": [1792886400000], "long": [1500], "short": [500]}

t contains UTC Unix timestamps in milliseconds; entries line up with the same index in v or long/short. The response's source identifies the storage source above.

Coverage: liquidation buckets are sparse. An omitted or empty bucket can mean no observed events or missing recording; it is not proof of zero exchange activity. Recorded history boundaries do not establish complete exchange history. Check gaps, db and any error; gaps: null means coverage is unknown, and an empty response can mean history is unavailable.

No API key is needed for these examples. Request limits apply; respect Retry-After on HTTP 429. See the API documentation for current limits, fields and usage terms.

Coverage. Every liquidation on crypto perps (liquidation fills on the public trade stream); OI, volume and funding polled every 60s; added 2026-09-28. Markets: perp.

How it's counted. Open interest is the USD value of open perpetual positions (one side) at the mark price, summed over the Lighter markets this site tracks; stablecoin pairs are left out. Funding is the 8-hour equivalent, weighted by each market's open interest. OI changes come from 5-minute snapshots this site records and show "—" until that much history exists.

Lighter FAQ

How much open interest is on Lighter?

The total at the top of this page is the USD value of open Lighter perpetual futures positions, summed over every market this site tracks and valued at the current mark price. It refreshes with every page load.

What is Lighter's OI-weighted funding rate?

The average funding across Lighter's perps, weighted by each market's open interest and shown per 8 hours. Positive means longs pay shorts on balance. See every market's rate in the table or on funding rates.

Where can I see Lighter funding rate history?

Over the last seven completed UTC days, 2026-11-06 to 2026-11-12: BTC mean 0.0094%/8h (168 observed hours out of 168); ETH mean 0.0072%/8h (168 observed hours out of 168). These are recorded rate observations, not settled payments; coverage applies to BTC and ETH only, not every perpetual market. See Lighter funding rate history. See Lighter funding rates now.

Does this page show Lighter liquidations?

Yes: this page shows Lighter liquidations over the last 24 hours, split into longs and shorts. Coverage: Every liquidation on crypto perps (liquidation fills on the public trade stream); OI, volume and funding polled every 60s; added 2026-09-28.

Where does the data come from?

Lighter's public market-data API, read live by this site. Nothing here comes from paid data vendors.