Crypto funding rates: 1 October 2026
On 1 October 2026 (UTC), the open-interest-weighted average funding rate across 1,661 liquid perps on 9 exchanges was 0.0056% per 8h (about 6.1% APR); 1,494 liquid perpetual markets had positive day-average quoted funding and 158 had negative day-average quoted funding. By coin, BTC 0.0053% per 8h observed mean (14/14 markets with 24/24 hours), against 0.0046% on 30 Sep 2026 (14/14 markets with 24/24 hours). ETH 0.0051% per 8h observed mean (14/14 markets with 24/24 hours), against 0.0062% on 30 Sep 2026 (14/14 markets with 24/24 hours). The highest was BOB on Binance at 0.4247% per 8h (about 465.0% APR); the most negative was ARK on Bybit at -5.6956% per 8h.
Highest funding
day average per 8h · one market per coin| # | Coin | Exchange | Per 8h | APR | OI |
|---|---|---|---|---|---|
| 1 | BOB | Binance 24/24 hours |
0.4247% | 465.0% | $1.24M |
| 2 | 龙虾 | Aster 24/24 hours |
0.2540% | 278.1% | $3.08M |
| 3 | SIREN | Bybit 24/24 hours |
0.1909% | 209.0% | $849K |
| 4 | POWER | Bybit 24/24 hours |
0.1631% | 178.6% | $868K |
| 5 | PUMPBTC | Binance 24/24 hours |
0.1475% | 161.6% | $1.46M |
| 6 | BTR | Bybit 24/24 hours |
0.1239% | 135.7% | $1.22M |
| 7 | TRUTH | Bybit 24/24 hours |
0.1192% | 130.5% | $660K |
| 8 | PHAROS | Binance 24/24 hours |
0.1169% | 128.0% | $6.09M |
| 9 | TMX | Bybit 24/24 hours |
0.1165% | 127.6% | $560K |
| 10 | ESPORTS | Binance 24/24 hours |
0.1096% | 120.0% | $6.83M |
| 11 | ARX | Gate 24/24 hours |
0.1073% | 117.5% | $668K |
| 12 | ZEST | Bybit 24/24 hours |
0.1040% | 113.8% | $781K |
| 13 | PTB | Bybit 24/24 hours |
0.1022% | 111.9% | $636K |
| 14 | BTW | Bybit 24/24 hours |
0.0984% | 107.7% | $16.61M |
| 15 | LONGXIA | Bybit 24/24 hours |
0.0978% | 107.1% | $1.37M |
| 16 | LIGHT | Bybit 24/24 hours |
0.0975% | 106.8% | $1.04M |
| 17 | 4STOCK | Bybit 24/24 hours |
0.0953% | 104.4% | $916K |
| 18 | TUT | Bybit 24/24 hours |
0.0948% | 103.8% | $690K |
| 19 | US | Bybit 24/24 hours |
0.0926% | 101.4% | $5.43M |
| 20 | STONK | Bitget 24/24 hours |
0.0892% | 97.7% | $617K |
Most negative funding
day average per 8h · one market per coin| # | Coin | Exchange | Per 8h | APR | OI |
|---|---|---|---|---|---|
| 1 | ARK | Bybit 24/24 hours |
-5.6956% | -6236.7% | $2.05M |
| 2 | PEAQ | Bybit 24/24 hours |
-0.3076% | -336.8% | $714K |
| 3 | ONE | Binance 24/24 hours |
-0.2698% | -295.4% | $8.89M |
| 4 | MOVE | Binance 24/24 hours |
-0.0946% | -103.6% | $3.03M |
| 5 | RAYDIUM | Bybit 24/24 hours |
-0.0924% | -101.2% | $3.14M |
| 6 | VTHO | Binance 24/24 hours |
-0.0633% | -69.3% | $3.92M |
| 7 | SOON | Bitget 24/24 hours |
-0.0614% | -67.3% | $9.17M |
| 8 | NMR | Binance 24/24 hours |
-0.0576% | -63.1% | $6.53M |
| 9 | COTI | Binance 24/24 hours |
-0.0549% | -60.2% | $7.35M |
| 10 | SAGA | Bybit 24/24 hours |
-0.0488% | -53.5% | $1.13M |
| 11 | XCN | Bybit 24/24 hours |
-0.0483% | -52.9% | $566K |
| 12 | CVC | Bybit 24/24 hours |
-0.0437% | -47.8% | $613K |
| 13 | BZ | Bybit 24/24 hours |
-0.0408% | -44.7% | $8.32M |
| 14 | TRX | Bybit 24/24 hours |
-0.0406% | -44.4% | $27.81M |
| 15 | FLOCK | Binance 24/24 hours |
-0.0372% | -40.7% | $3.67M |
| 16 | EGLD | Bitget 24/24 hours |
-0.0368% | -40.3% | $1.02M |
| 17 | QNT | Gate 24/24 hours |
-0.0361% | -39.5% | $2.45M |
| 18 | 2Z | Bybit 24/24 hours |
-0.0342% | -37.4% | $1.21M |
| 19 | CT | Binance 14/24 hours · partial |
-0.0332% | -36.4% | $3.21M |
| 20 | B3 | Bybit 24/24 hours |
-0.0320% | -35.0% | $636K |
Average funding by exchange
liquid perps, OI-weighted, per 8h| Exchange | Average | APR | Liquid perps | Positive mean quote | Negative mean quote | Open interest |
|---|---|---|---|---|---|---|
| Binance 583/584 with 24/24 hours · partial |
0.0055% | 6.0% | 584 | 546 | 38 | $30.38B |
| Bybit 430/430 with 24/24 hours |
0.0028% | 3.0% | 430 | 353 | 69 | $6.75B |
| Hyperliquid 123/123 with 24/24 hours |
0.0092% | 10.0% | 123 | 118 | 5 | $6.31B |
| Gate 132/132 with 24/24 hours |
0.0035% | 3.8% | 132 | 118 | 14 | $5.41B |
| Bitget 245/245 with 24/24 hours |
0.0090% | 9.8% | 245 | 233 | 12 | $3.75B |
| HTX 32/32 with 24/24 hours |
0.0038% | 4.2% | 32 | 26 | 5 | $3.08B |
| Aster 62/62 with 24/24 hours |
0.0076% | 8.3% | 62 | 54 | 8 | $1.18B |
| Lighter 49/49 with 24/24 hours |
0.0083% | 9.0% | 49 | 42 | 7 | $473.33M |
| KuCoin 4/4 with 24/24 hours |
0.0116% | 12.7% | 4 | 4 | 0 | $95.87M |
Observed hours count usable hourly funding averages out of 24 UTC buckets, not settlement counts or full five-minute/feed coverage. A closed date does not establish complete observations. Partial markets may be newly listed or partly recorded; missing hours are not zero-filled and missing rates remain unavailable. Venue coverage counts markets with 24 observed hours out of the eligible liquid markets in that mean. Sign counts are liquid perpetual markets with positive or negative day-average recorded quotes; zero averages are in the liquid total only. Rates are hourly recorded quotes normalized to 8-hour equivalents, averaged over the UTC day; "liquid" means at least $500K average open interest. HIP-3 (stock and other non-crypto) perps are left out. Live funding rates.
Share this day's card
1200×630 PNG · free to use with a link back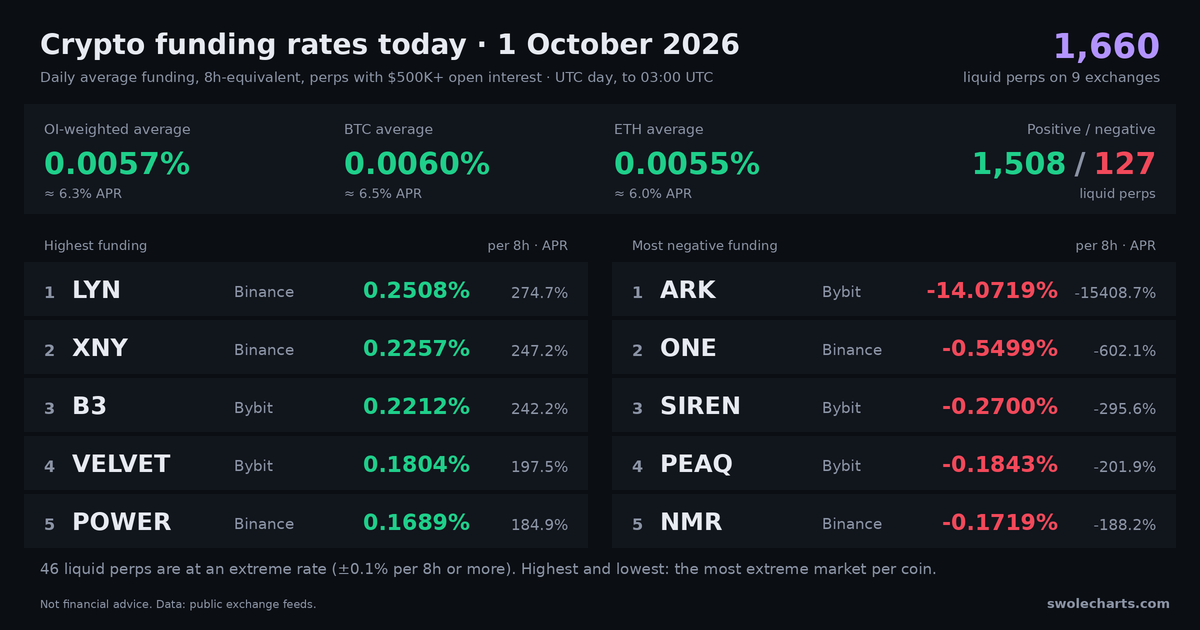
Download the card · Share on X · Reddit · · Permalink: https://swolecharts.com/funding-rates/daily/2026-10-01
Daily funding card FAQ
How is the daily funding rate calculated?
For each perpetual market we average its hourly recorded funding quotes over the UTC day, normalized to an 8-hour equivalent so exchanges with 1-hour, 4-hour and 8-hour intervals compare directly. The headline is the average across liquid perps (at least $500K average open interest), weighted by open interest. Sign counts classify liquid markets by their mean recorded quote; rates can change sign during the day. Zero averages count toward the total, but neither sign count. These are quoted-rate averages, not summed settled payments or a user's realized P&L.
What do positive and negative funding mean?
If funding settles at a positive rate, longs pay shorts, usually because perps trade above spot and demand for leverage is long. If it settles at a negative rate, shorts pay longs. A day-average quote does not establish the sign of every settlement. 0.01% per 8 hours (about 11% a year) is the usual baseline; 0.1% per 8 hours or more is extreme.
Can I share or cite the card?
Yes. Each day has a permanent page and a 1200×630 image at the same address plus .png. Please link back to the page when you use the numbers or the image.