MEXC Open Interest, Volume and Funding Rates
Live MEXC derivatives data from its public API: total open interest and its share of all exchanges tracked here, 24h volume, OI-weighted funding and the largest markets by open interest. See the MEXC funding rate history FAQ for recorded BTC/ETH rates and coverage.
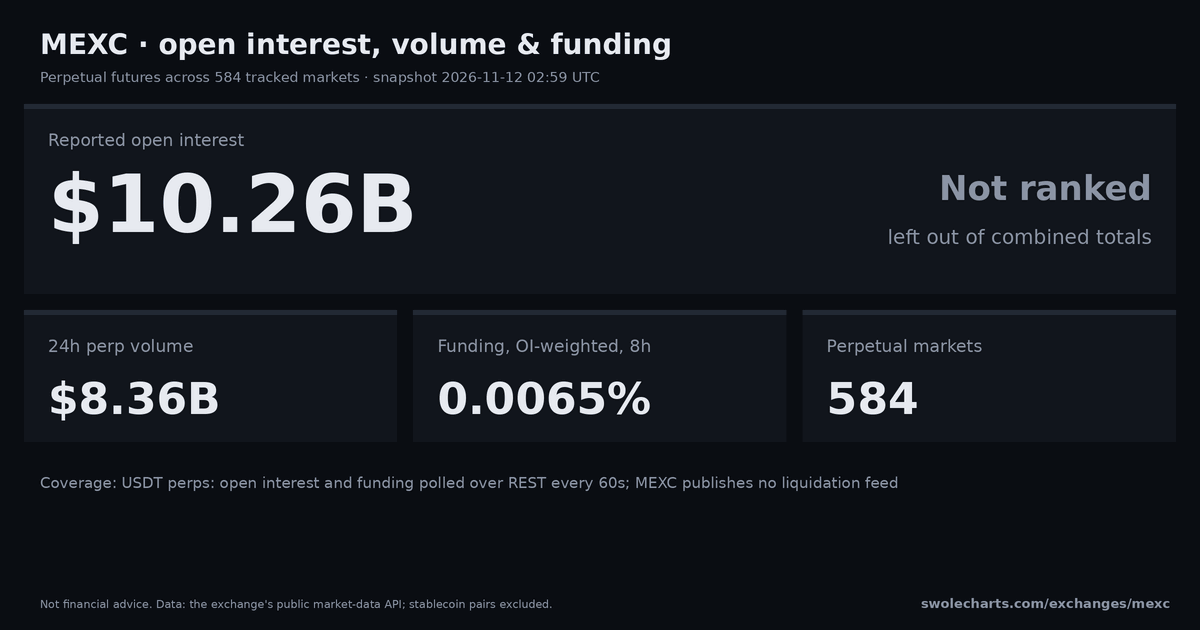
MEXC has $10.27B of perpetual open interest across 584 markets, not ranked and left out of combined totals: MEXC's reported open interest moves about 6.8 times more than its own trades imply, so it is shown per market but not added to combined totals. See /data-accuracy#oi-totals. BTC is its largest market at $4.89B (47.7% of MEXC OI), and OI-weighted funding is 0.0065% per 8h (472 of 577 markets with nonzero funding have longs paying shorts). Funding coverage: 7 flat · 0 no data. The biggest 24h open interest move among markets with at least $1M OI is AGT (AGT_USDT): +873.68%.
Share: Share on X Telegram Reddit Download the 1200×630 card
Top MEXC markets by open interest
top 50 of 584 perps| # | Market | Price | Open interest | Share | OI 1h | OI 24h | Funding / 8h | Vol 24h | Trade |
|---|---|---|---|---|---|---|---|---|---|
| 1 | BTC BTC_USDT | 73,800.8 | $4.89B | 47.7% | +0.19% | +1.65% | 0.0078% | $2.60B | Trade ↗ |
| 2 | ETH ETH_USDT | 2,057.4 | $1.78B | 17.4% | +1.28% | +7.88% | 0.0072% | $1.13B | Trade ↗ |
| 3 | XAU XAU_USDT | 3,988.8 | $500.12M | 4.9% | +0.89% | +9.36% | 0.0090% | $422.53M | Trade ↗ |
| 4 | SOL SOL_USDT | 83.330 | $454.25M | 4.4% | +7.88% | +44.39% | 0.0010% | $584.80M | Trade ↗ |
| 5 | XAUT XAUT_USDT | 3,975.2 | $315.79M | 3.1% | -0.06% | -0.22% | 0.0160% | $105.16M | Trade ↗ |
| 6 | XRP XRP_USDT | 1.050 | $203.34M | 2.0% | +0.38% | -4.40% | 0.0040% | $255.83M | Trade ↗ |
| 7 | SILVER SILVER_USDT | 51.590 | $164.29M | 1.6% | +13.49% | +10.67% | 0.0000% | $171.17M | Trade ↗ |
| 8 | PEPE PEPE_USDT | 0.0000046062 | $137.84M | 1.3% | -13.93% | -4.53% | -0.0134% | $73.23M | Trade ↗ |
| 9 | ZEC ZEC_USDT | 993.34 | $111.92M | 1.1% | +0.75% | -10.04% | 0.0100% | $2.01B | Trade ↗ |
| 10 | HYPE HYPE_USDT | 72.134 | $101.66M | 1.0% | +10.07% | +6.85% | 0.0100% | $28.16M | Trade ↗ |
| 11 | TAO TAO_USDT | 215.65 | $68.51M | 0.7% | +0.26% | +9.34% | 0.0026% | $42.44M | Trade ↗ |
| 12 | SUI SUI_USDT | 0.8220 | $58.38M | 0.6% | +3.36% | -7.79% | -0.0032% | $42.34M | Trade ↗ |
| 13 | NEAR NEAR_USDT | 3.569 | $46.67M | 0.5% | +4.59% | +4.68% | 0.0100% | $36.69M | Trade ↗ |
| 14 | BNB BNB_USDT | 680.63 | $46.66M | 0.5% | +0.44% | -1.43% | 0.0000% | $6.50M | Trade ↗ |
| 15 | ENA ENA_USDT | 0.1449 | $45.94M | 0.4% | -1.59% | -9.22% | 0.0100% | $32.01M | Trade ↗ |
| 16 | DOGE DOGE_USDT | 0.06749 | $42.81M | 0.4% | -1.03% | -24.57% | -0.0004% | $85.34M | Trade ↗ |
| 17 | ADA ADA_USDT | 0.1739 | $41.08M | 0.4% | +2.67% | +3.99% | -0.0017% | $18.20M | Trade ↗ |
| 18 | WLD WLD_USDT | 0.3074 | $33.59M | 0.3% | +0.46% | -3.93% | -0.0113% | $22.90M | Trade ↗ |
| 19 | ANTHROPIC ANTHROPIC_USDT | 1,379.8 | $32.30M | 0.3% | +2.72% | +21.09% | 0.0050% | $5.33M | Trade ↗ |
| 20 | LTC LTC_USDT | 49.960 | $29.55M | 0.3% | +0.51% | -4.29% | 0.0006% | $3.77M | Trade ↗ |
| 21 | ONDO ONDO_USDT | 0.3578 | $28.09M | 0.3% | +0.02% | -0.27% | 0.0052% | $9.77M | Trade ↗ |
| 22 | HBAR HBAR_USDT | 0.06556 | $27.46M | 0.3% | +0.92% | +26.62% | -0.0095% | $8.51M | Trade ↗ |
| 23 | LINK LINK_USDT | 10.167 | $26.03M | 0.3% | -3.58% | -12.76% | 0.0040% | $91.67M | Trade ↗ |
| 24 | AVAX AVAX_USDT | 8.600 | $25.59M | 0.2% | +1.97% | +1.62% | 0.0038% | $22.53M | Trade ↗ |
| 25 | UNI UNI_USDT | 6.221 | $22.95M | 0.2% | +3.94% | -10.96% | 0.0071% | $43.02M | Trade ↗ |
| 26 | BCH BCH_USDT | 229.41 | $22.75M | 0.2% | +0.24% | -2.60% | 0.0059% | $1.64M | Trade ↗ |
| 27 | CAD CAD_USDT | 0.7019 | $21.78M | 0.2% | -0.04% | -0.44% | 0.0274% | $142K | Trade ↗ |
| 28 | GBP GBP_USDT | 1.327 | $21.08M | 0.2% | -0.14% | +0.83% | 0.0276% | $222K | Trade ↗ |
| 29 | XPD XPD_USDT | 1,039.4 | $18.58M | 0.2% | -0.05% | +2.93% | 0.0116% | $867K | Trade ↗ |
| 30 | XLM XLM_USDT | 0.1474 | $16.68M | 0.2% | +1.56% | -1.99% | -0.0063% | $28.78M | Trade ↗ |
| 31 | QNT QNT_USDT | 165.58 | $16.05M | 0.2% | +4.95% | -15.14% | -0.0015% | $36.37M | Trade ↗ |
| 32 | PAXG PAXG_USDT | 3,975.6 | $15.07M | 0.1% | -0.01% | +0.87% | 0.0100% | $878K | Trade ↗ |
| 33 | FARTCOIN FARTCOIN_USDT | 0.1133 | $14.33M | 0.1% | +10.57% | +16.11% | 0.0100% | $4.01M | Trade ↗ |
| 34 | XPT XPT_USDT | 1,539.8 | $14.04M | 0.1% | -2.15% | -6.67% | 0.0000% | $1.26M | Trade ↗ |
| 35 | AAVE AAVE_USDT | 118.79 | $13.87M | 0.1% | +0.52% | -19.88% | 0.0051% | $8.66M | Trade ↗ |
| 36 | WIF WIF_USDT | 0.1548 | $13.52M | 0.1% | +0.94% | +4.00% | 0.0100% | $1.27M | Trade ↗ |
| 37 | COPPER COPPER_USDT | 6.338 | $13.39M | 0.1% | -0.10% | +4.65% | 0.0000% | $545K | Trade ↗ |
| 38 | CHF CHF_USDT | 1.200 | $13.38M | 0.1% | -0.08% | -1.12% | 0.0244% | $114K | Trade ↗ |
| 39 | INJ INJ_USDT | 7.497 | $13.25M | 0.1% | +0.39% | -17.91% | -0.0033% | $16.58M | Trade ↗ |
| 40 | FET FET_USDT | 0.1479 | $13.10M | 0.1% | -0.11% | -3.99% | 0.0080% | $5.22M | Trade ↗ |
| 41 | DOT DOT_USDT | 0.8458 | $13.03M | 0.1% | +0.40% | -1.83% | -0.0003% | $8.16M | Trade ↗ |
| 42 | POL POL_USDT | 0.08702 | $12.81M | 0.1% | +0.23% | +1.34% | -0.0086% | $572K | Trade ↗ |
| 43 | ASTER ASTER_USDT | 0.6560 | $12.58M | 0.1% | -0.48% | -14.01% | 0.0100% | $3.19M | Trade ↗ |
| 44 | TIA TIA_USDT | 0.4141 | $12.45M | 0.1% | +0.57% | +23.73% | 0.0090% | $8.66M | Trade ↗ |
| 45 | JPY JPY_USDT | 0.006272 | $12.39M | 0.1% | -0.05% | -0.77% | 0.0400% | $112K | Trade ↗ |
| 46 | AKT AKT_USDT | 0.5993 | $11.58M | 0.1% | +1.20% | -2.04% | 0.0100% | $211K | Trade ↗ |
| 47 | ARB ARB_USDT | 0.1519 | $11.47M | 0.1% | +3.43% | -36.39% | -0.0121% | $16.48M | Trade ↗ |
| 48 | VET VET_USDT | 0.005207 | $11.04M | 0.1% | +0.37% | -4.14% | -0.0012% | $329K | Trade ↗ |
| 49 | PUMPFUN PUMPFUN_USDT | 0.003485 | $11.04M | 0.1% | +3.20% | -2.37% | 0.0074% | $11.44M | Trade ↗ |
| 50 | LUNC LUNC_USDT | 0.00003817 | $10.97M | 0.1% | +0.15% | -3.26% | -0.0272% | $495K | Trade ↗ |
- Perp volume (24h)
- MEXC 24h perp volume, USD (left)
- share of all exchanges tracked (right)
MEXC has no open interest share: MEXC's reported open interest moves about 6.8 times more than its own trades imply, so it is shown per market but not added to combined totals.
Daily numbers (41 UTC days, newest first)
| Date | Volume | Vol share |
|---|---|---|
| $8.39B | 9.5% | |
| $8.32B | 9.5% | |
| $10.21B | 9.1% | |
| $10.51B | 9.7% | |
| $6.23B | 9.3% | |
| $4.65B | 14.3% | |
| $9.76B | 10.2% | |
| $13.75B | 8.7% | |
| $13.72B | 8.7% | |
| $8.57B | 11.0% | |
| $10.24B | 11.2% | |
| $4.76B | 11.2% | |
| $4.55B | 11.5% | |
| $12.15B | 8.6% | |
| $13.71B | 8.1% | |
| $9.84B | 11.1% | |
| $8.52B | 11.1% | |
| $9.94B | 10.7% | |
| $6.21B | 11.1% | |
| $8.12B | 10.1% | |
| $10.37B | 11.9% | |
| $11.94B | 10.7% | |
| $10.24B | 9.7% | |
| $10.50B | 10.1% | |
| $9.35B | 10.7% | |
| $7.86B | 10.5% | |
| $5.68B | 11.6% | |
| $10.38B | 10.3% | |
| $13.20B | 9.1% | |
| $11.21B | 9.8% | |
| $10.89B | 9.9% | |
| $10.60B | 9.8% | |
| $6.49B | 11.0% | |
| $4.98B | 11.8% | |
| $9.01B | 11.0% | |
| $10.43B | 9.0% | |
| $9.45B | 11.3% | |
| $9.85B | 9.6% | |
| $6.55B | 11.8% | |
| $5.12B | 12.0% | |
| $11.80B | 8.0% |
Coverage. USDT perps: open interest and funding polled over REST every 60s; MEXC publishes no liquidation feed. Markets: perp.
How it's counted. Open interest is the USD value of open perpetual positions (one side) at the mark price, summed over the MEXC markets this site tracks; stablecoin pairs are left out. Funding is the 8-hour equivalent, weighted by each market's open interest. OI changes come from 5-minute snapshots this site records and show "—" until that much history exists.
MEXC FAQ
How much open interest is on MEXC?
The total at the top of this page is the USD value of open MEXC perpetual futures positions, summed over every market this site tracks and valued at the current mark price. It refreshes with every page load.
What is MEXC's OI-weighted funding rate?
The average funding across MEXC's perps, weighted by each market's open interest and shown per 8 hours. Positive means longs pay shorts on balance. See every market's rate in the table or on funding rates.
Where can I see MEXC funding rate history?
Over the last seven completed UTC days, 2026-11-05 to 2026-11-11: BTC mean 0.0070%/8h (168 observed hours out of 168); ETH mean 0.0041%/8h (168 observed hours out of 168). These are recorded rate observations, not settled payments; coverage applies to BTC and ETH only, not every perpetual market. See MEXC funding rate history. See MEXC funding rates now.
Does this page show MEXC liquidations?
No. USDT perps: open interest and funding polled over REST every 60s; MEXC publishes no liquidation feed. Liquidations on other exchanges are on the liquidations page.
Where does the data come from?
MEXC's public market-data API, read live by this site. Nothing here comes from paid data vendors.