G live: funding rate, open interest, liquidations & volume spikes
Share: Share on X Telegram Reddit Download the 1200×630 card
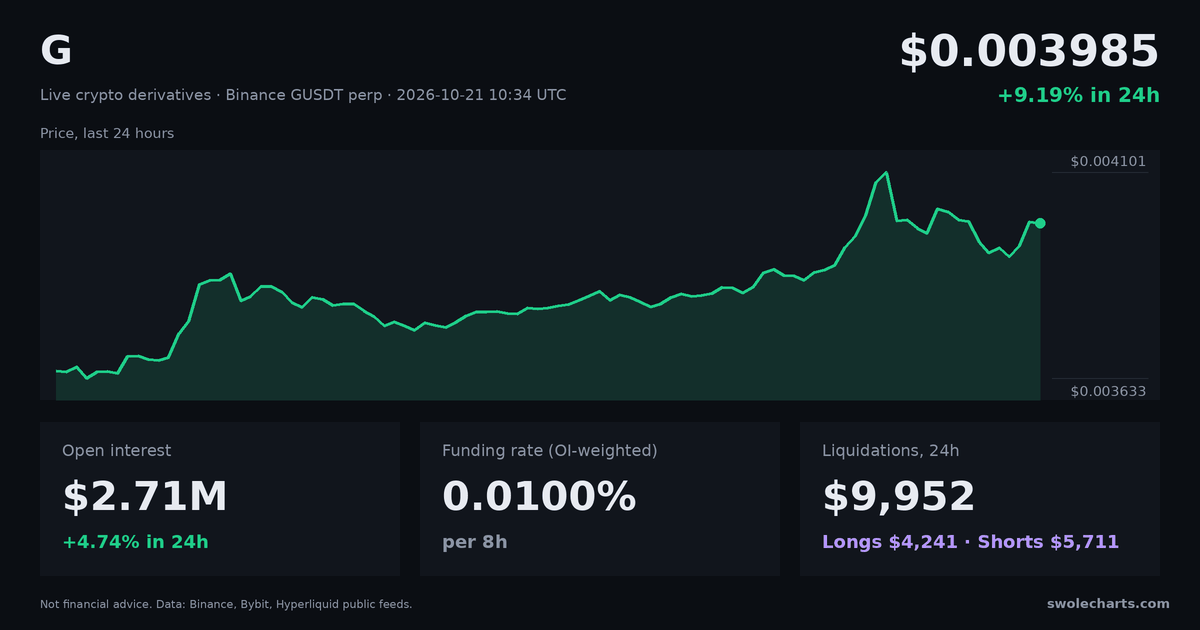
Since yesterday
OI 24h: now vs 24h ago. Funding 24h: mean 8h-equivalent rate, last 24h vs the 24h before, hourly recorded history. Liquidations 24h: last 24h vs the 24h before, hourly recorded history. Recorded, refreshed every 15 minutes.
Live market summary
G trades on 6 exchanges tracked by Swolecharts (Aster, Binance, Bitget, Gate, KuCoin and MEXC) across 6 perpetual futures and 1 spot market. The last price is 0.002980 USDT on Binance (+0.61% in the last hour), and 24h volume is $2.46M ($2.19M perps, $271K spot). Perpetual open interest totals $2.61M. The OI-weighted funding rate is 0.0100% per 8h (≈11% APR), so longs pay shorts. $2,915 of G positions were liquidated on Binance, Bitget, Aster and Gate in the last 24 hours, 100% longs and 0% shorts. No G volume spikes were flagged in the last 24 hours.
G open interest, funding and liquidations history
· From recorded history, hourly
G open interest is $2.61M, down 30.0% over the past 7 days, and down 1.9% in the last 24 hours. G recorded funding quotes have averaged -0.0090% per 8 hours over the past 7 days (≈-10% APR, annualized quote). Recorded hourly quote readings were 46% positive, 54% negative and 0% zero. $90K of G positions were liquidated over the past 7 days: $90K longs (99.7%) and $265 shorts. The biggest hour was 21:00 UTC on 8 Nov, with $30K.
G price
Loading chart…
Not recorded Chart: TradingView Lightweight Charts™
G open interest
All perps, USDLoading chart…
Not recorded Chart: TradingView Lightweight Charts™
G funding rate
OI-weighted, 8hLoading chart…
Not recorded Chart: TradingView Lightweight Charts™
G liquidations
Longs up, shorts downLoading chart…
Not recorded Chart: TradingView Lightweight Charts™
G CVD and taker flow
Spot vs perp, from range start · bars: net taker buysLoading chart…
Not recorded Chart: TradingView Lightweight Charts™
G markets: funding rate & open interest by exchange
Funding as 8h equivalent (hover for APR) · OI changes need history| Market | Price | Price 1h | Price 24h | 24h volume | Funding 8h | Open interest, USD | OI 1h | OI 4h | OI 24h | Trade |
|---|---|---|---|---|---|---|---|---|---|---|
| BinanceperpGUSDT | 0.002980 | +0.61% | -1.52% | $1.94M | 0.0100% | $1.84M | +1.04% | -0.41% | -3.79% | Trade |
| KuCoinperpGUSDTM | 0.002983 | +0.51% | -1.58% | $37K | 0.0100% | $310K | +0.44% | -0.44% | +11.26% | Trade |
| MEXCperpG_USDT | 0.002980 | +0.57% | -1.58% | $109K | 0.0100% | $267K * | +0.44% | -0.53% | -1.22% | Trade |
| BitgetperpGUSDT | 0.002980 | +0.34% | -1.71% | $80K | 0.0100% | $228K | +0.45% | +0.67% | +1.65% | Trade |
| AsterperpGUSDT | 0.002983 | +0.30% | -1.70% | $7,148 | 0.0100% | $151K | +0.35% | -0.41% | -1.64% | Trade |
| GateperpG_USDT | 0.002980 | +0.44% | -1.65% | $26K | 0.0100% | $79K | +0.41% | +0.03% | -2.65% | Trade |
| BinancespotGUSDT | 0.002980 | +0.34% | -1.65% | $271K | — | — | — | — | — | Trade |
Trade links go to the exchange and may be referral links.
G long/short ratio
All coins' long/short ratios →| Series | Now | 24h |
|---|
Share of longs; changes in percentage points (pp). Accounts = share of accounts with a net long position; top trader accounts = the same for the exchange's top traders (Binance: top 20% by margin); top trader positions = share of their combined position that is long; top traders vs accounts = top trader positions long minus accounts long, in pp (negative: the big traders are less long than the crowd); taker buys = share of the last 5 minutes' taker volume that bought. New points every 5 minutes; 24h history backfilled from the exchanges. Gate, Bitget and HTX are tracked for the top 50 coins.
No current long/short ratio observations are available for G. Feed coverage may be absent or observations may be delayed or expired. See the coins that are tracked →
G volume spikes
See live spikes for all coins →No G volume spikes in the last 24 hours. A spike is a minute with at least 4× normal volume; new ones appear here live.
| Time | Venue | Type | Side | $ in 1m | × normal | Buy % | +5m | +15m | +1h |
|---|
Newest first, up to 100. +5m / +15m / +1h show the price change after each spike and fill in as time passes. They describe the past, not a prediction.
G spike outcomes: how often price kept going 5, 15 and 60 minutes after a spike →
G liquidations: long vs short
All liquidations →| Window | Longs | Shorts | Long / short | Count |
|---|---|---|---|---|
| 1h | $0 | $0 | 0 | |
| 4h | $2,599 | $0 | 6 | |
| 24h | $2,916 | $0 | 16 |
Biggest G liquidations, 24h
- BINLONG$1,071@ 0.0029554h ago
- BINLONG$661@ 0.0029694h ago
- BINLONG$493@ 0.0029674h ago
- BITLONG$323@ 0.0029214h ago
- BINLONG$107@ 0.0030459h ago
Latest
- No recent G liquidations.
From the public liquidation feeds of Binance, Bitget, Aster and Gate. KuCoin and MEXC do not publish liquidations, so G perps there are not counted. Binance, Bitget and Aster publish only a sample of liquidations (Binance at most one per symbol per second), so totals are a lower bound. A long liquidation is a forced sell; a short liquidation is a forced buy.
About the G numbers
G funding rate
Perpetual futures have no expiry, so exchanges keep their price close to spot with periodic funding payments between longs and shorts. A positive G funding rate means longs pay shorts (more demand for leveraged longs); negative means shorts pay longs. Rates here are converted to an 8-hour equivalent so exchanges with 1h, 4h and 8h intervals compare directly, and the headline figure is weighted by each exchange's open interest.
G open interest
Open interest is the USD value of all open G perpetual positions. Rising OI alongside a price move means new positions are opening; falling OI means positions are closing (including liquidations). OI changes are measured from 5-minute snapshots.
G liquidations
A liquidation is a leveraged position the exchange closed by force. Long liquidations are forced sells that hit when price drops; short liquidations are forced buys when price rises. The long/short split shows which side was caught.
G volume spikes
A spike is a minute where one G market traded at least 4× its normal minute volume, with a size floor. Buy % is the share of taker buys. The +5m / +15m / +1h columns show what price did afterwards. They are history, not a signal. Not financial advice.