Akedo (AKE) RSI
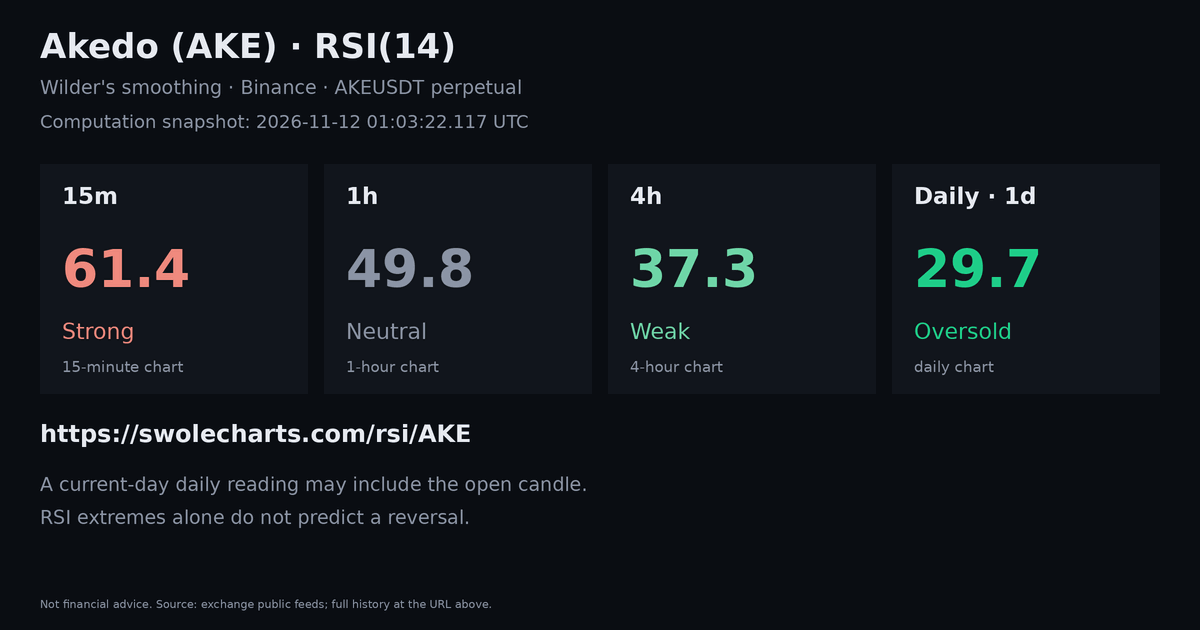
Akedo RSI(14) right now: 15m 76.9, 1h 56.9, 4h 39.6, 1d 30.1. AKE is overbought on the 15m chart. Over the 19 days since 23 Oct 2026 its daily RSI closed at 70 or above on 0 days and below 30 on 4 days. In the last 90 days the daily RSI ranged from 27.1 to 63.4.
Computation snapshot: 2026-11-12 00:42:43.446 UTC. This is the RSI calculation time.
Share: Share on X Telegram Reddit Download the 1200×630 card
The latest daily RSI history refresh failed, so the chart and the overbought and oversold days below are from the last good read, 4 hours old; it retries within 30 seconds. The live readings above are current.
Daily RSI(14) · last 90 days
14 Aug 2026 – 11 Nov 2026 · today's point is provisionalDaily RSI(14) Overbought, 70+ Oversold, below 30
AKE RSI(14) by timeframe
Binance AKEUSDT · price 0.002768| Timeframe | RSI(14) | Zone | Candles |
|---|---|---|---|
| 15-minute 15m | 76.9 | Overbought | 100 |
| 1-hour 1h | 56.9 | Neutral | 100 |
| 4-hour 4h | 39.6 | Weak | 100 |
| daily 1d | 30.1 | Weak | 46 |
How to read it. RSI(14) measures how much of AKE's recent movement was up: 70+ overbought, 60–70 strong, 40–60 neutral, 30–40 weak, below 30 oversold. Each value includes the current open candle, so it moves live. Compare every coin on the crypto RSI heatmap, see AKE price, funding and open interest, or read RSI, MACD and moving averages explained.
Candles come from 1-minute bars this site records from Binance, Bybit and Hyperliquid public feeds, on AKE's most-traded perpetual over the last day. Daily history uses completed Binance spot USDT candles when available in memory, followed by recorded candles; today uses the recorded perpetual. Refreshed every two minutes; the daily history every 30 minutes. Not financial advice.
AKE RSI FAQ
Is Akedo overbought?
No: Akedo's daily RSI(14) is 30.1 (weak), between 30 and 70. On the 4-hour chart it is 39.6 (weak). RSI can stay overbought for a long time in a strong trend, so it is not a sell signal on its own. Not financial advice.
What RSI settings are used?
RSI(14) with Wilder's smoothing, TradingView's default: the average gain over the average loss of the last 14 candles, scaled to 0-100. Candles are built from 1-minute bars this site records from the exchanges' public feeds, on AKE's most-traded perpetual (Binance AKEUSDT). The current, still-open candle is included, so the values move live. Daily history uses completed Binance spot USDT candles when available in memory, followed by recorded candles; today comes from the recorded perpetual. 70 or above counts as overbought and below 30 as oversold.