Daily crypto liquidation recaps
One page per UTC day with that day's long and short liquidations across the exchanges we track, the top coins and exchanges and the largest single liquidation, each with a shareable 1200×630 card. Longs are closed out by a falling price, shorts by a rising one.
44 finished UTC days of liquidation recaps so far, newest first. The largest was 8 Nov 2026 with $773.0M liquidated, led by ETH. BTC was the most liquidated coin on 22 days of 44.
Latest full day: 11 Nov 2026
Liquidation recap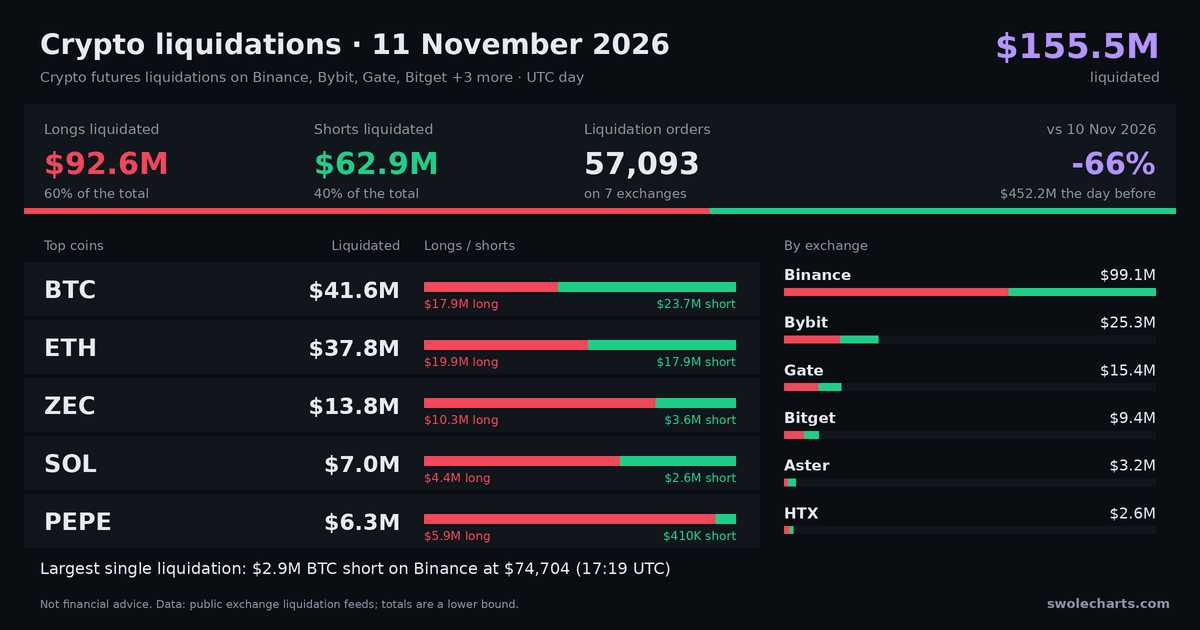
Every day has a permanent page and a 1200×630 card at the same address plus .png, free to share with a link back.
Liquidations by day
newest first · UTC days · USD| Day | Longs | Shorts | Total | Long share | Top coin |
|---|---|---|---|---|---|
| today | $881K | $1.54M | $2.42M | 36.4% | BTC $512K |
| $92.55M | $62.93M | $155.48M | 59.5% | BTC $41.59M | |
| $396.74M | $55.44M | $452.18M | 87.7% | ETH $207.22M | |
| $110.75M | $50.58M | $161.34M | 68.6% | ETH $57.87M | |
| $712.38M | $60.65M | $773.03M | 92.2% | ETH $351.13M | |
| $39.34M | $11.23M | $50.57M | 77.8% | XRP $6.28M | |
| $82.17M | $44.86M | $127.03M | 64.7% | BTC $41.94M | |
| $535.43M | $49.42M | $584.85M | 91.5% | BTC $220.76M | |
| $174.24M | $451.09M | $625.32M | 27.9% | BTC $270.19M | |
| $54.05M | $49.74M | $103.78M | 52.1% | BTC $38.98M | |
| $149.35M | $49.97M | $199.31M | 74.9% | BTC $62.81M | |
| $47.38M | $30.51M | $77.89M | 60.8% | BTC $16.72M | |
| $19.35M | $19.89M | $39.24M | 49.3% | ETH $6.52M | |
| $457.06M | $90.02M | $547.08M | 83.5% | BTC $223.63M | |
| $653.37M | $104.80M | $758.17M | 86.2% | BTC $262.16M | |
| $49.58M | $89.25M | $138.84M | 35.7% | BTC $38.52M | |
| $31.34M | $69.43M | $100.77M | 31.1% | ETH $30.17M | |
| $71.21M | $43.75M | $114.96M | 61.9% | BTC $33.90M | |
| $59.02M | $30.54M | $89.56M | 65.9% | ETH $30.29M | |
| $355.34M | $53.96M | $409.30M | 86.8% | ETH $138.37M | |
| $219.29M | $110.04M | $329.33M | 66.6% | BTC $69.31M | |
| $216.37M | $19.88M | $236.25M | 91.6% | BTC $79.43M | |
| $47.15M | $125.28M | $172.43M | 27.3% | ETH $53.32M | |
| $85.33M | $98.15M | $183.48M | 46.5% | ETH $70.28M | |
| $40.58M | $71.40M | $111.98M | 36.2% | ETH $44.15M | |
| $143.34M | $61.22M | $204.56M | 70.1% | ETH $58.58M | |
| $135.20M | $31.63M | $166.82M | 81.0% | ETH $55.45M | |
| $117.42M | $74.99M | $192.40M | 61.0% | BTC $60.15M | |
| $304.64M | $77.45M | $382.08M | 79.7% | ETH $144.95M | |
| $137.31M | $42.99M | $180.30M | 76.2% | ETH $50.40M | |
| $99.70M | $43.05M | $142.75M | 69.8% | ETH $44.94M | |
| $165.34M | $51.86M | $217.20M | 76.1% | ETH $72.62M | |
| $42.19M | $84.37M | $126.57M | 33.3% | ETH $29.63M | |
| $18.27M | $31.91M | $50.17M | 36.4% | STRK $5.98M | |
| $25.59M | $61.18M | $86.78M | 29.5% | BTC $26.69M | |
| $299.53M | $25.41M | $324.94M | 92.2% | ETH $132.93M | |
| $52.95M | $34.85M | $87.81M | 60.3% | BTC $21.03M | |
| $84.70M | $53.87M | $138.57M | 61.1% | BTC $55.53M | |
| $16.56M | $83.26M | $99.82M | 16.6% | BTC $37.24M | |
| $19.45M | $24.26M | $43.71M | 44.5% | SAND $7.75M | |
| $235.53M | $184.79M | $420.32M | 56.0% | BTC $150.99M | |
| $66.12M | $53.11M | $119.22M | 55.5% | BTC $27.88M | |
| $109.78M | $97.88M | $207.65M | 52.9% | BTC $70.98M | |
| $117.04M | $78.58M | $195.62M | 59.8% | ETH $56.54M | |
| $232.53M | $74.49M | $307.03M | 75.7% | BTC $83.55M | |
| partial | $35.88M | $31.81M | $67.70M | 53.0% | QNT $17.72M |
Totals come from the exchanges' public liquidation feeds, some of which publish only a sample, so they are a lower bound. The top coin is the coin with the most liquidated across all exchanges that day. Also see the liquidation history chart and per-exchange table.
Daily liquidation card FAQ
What does this daily liquidation card show?
The dollar value of crypto futures positions that exchanges force-closed during one UTC day (00:00 to 24:00 UTC), split into longs (closed by a falling price) and shorts (closed by a rising price), by coin and by exchange, with the day's largest single liquidation.
Can I share or cite the card?
Yes. Each day has a permanent page and a 1200×630 image at the same address plus .png. Please link back to the page when you use the numbers or the image.
Is every liquidation counted?
No site sees every liquidation. These come from the exchanges' public feeds, and some publish only a sample (Binance sends at most one liquidation per symbol per second), so totals are a lower bound. Compare days and the long/short balance rather than reading them as exact market totals.