Bitcoin (BTC) vs Ethereum (ETH)
Bitcoin (BTC) vs Ethereum (ETH) compared live: price, open interest, funding, volume, liquidations, top-trader positioning and realised volatility, summed or OI-weighted across every exchange tracked, with both coins rebased to 100 on one chart. Compare other coins.
ETH has a 30-day correlation of 0.94 with BTC and a 90-day beta of 1.26. BTC has 1.9x the open interest of ETH ($21.21B vs $11.40B). Funding is higher on BTC (0.0071% vs 0.0025% per 8h, OI-weighted across exchanges); longs pay shorts on both coins, so its longs are paying more to hold the position. ETH has been the more volatile of the two over 30 days: 50% annualised realised volatility against 35% for BTC.
BTC vs ETH side by side
| Metric | BTC | ETH |
|---|---|---|
| Price | $72,679.2 | $2,013.4 |
| Price 24h | -1.50% | -1.87% |
| Return 7d | -8.06% | -15.19% |
| Return 30d | -9.57% | -15.97% |
| Return 90d | +16.58% | +9.01% |
| Open interest | $21.21B | $11.40B |
| OI 24h | -1.08% | -1.61% |
| Funding / 8h | 0.0071% | 0.0025% |
| Volume 24h | $36.49B | $22.64B |
| Long liqs 24h | $57.33M | $56.15M |
| Short liqs 24h | $22.07M | $14.96M |
| Top traders long | — | — |
| Volatility 30d | 35.0% | 49.8% |
| Correlation 30d | 0.94 | |
| Correlation 90d | 0.90 | |
| Beta to BTC 90d | 1.26 | |
Share: Share on X Telegram Reddit Download the 1200×630 card
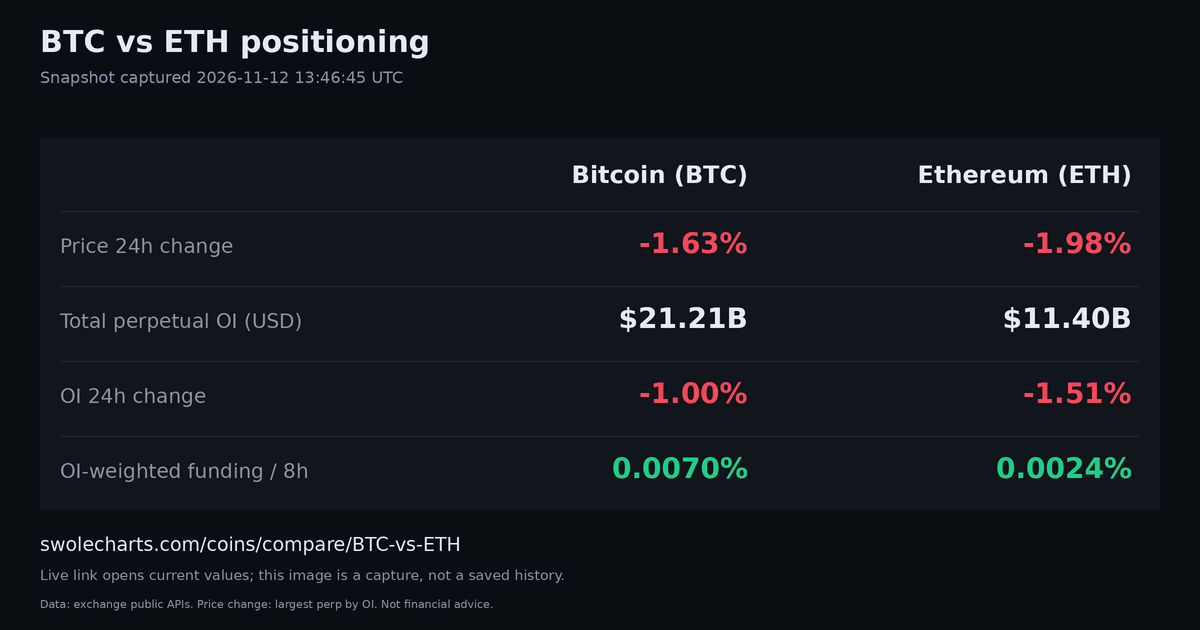
Snapshot captured 2026-11-12 13:37:38 UTC. Partial venue coverage; stale fields excluded. The shared link opens current values; the card is a capture, not a stored historical snapshot. The charts below and their Save image actions show separate historical comparisons.
BTC vs ETH drawdown and recovery
Binance spot USDT daily closes. Identical windows of completed UTC days through , including the preceding daily close as the initial boundary.
| Coin / window | Max drawdown | Peak (UTC) | Trough (UTC) | Recovery / elapsed |
|---|---|---|---|---|
| BTC / 30d | -12.25% | 2026-10-21 | 2026-11-10 | Still underwater 21 calendar days through 2026-11-11 |
| ETH / 30d | -17.80% | 2026-10-13 | 2026-11-10 | Still underwater 29 calendar days through 2026-11-11 |
| BTC / 90d | -14.80% | 2026-09-21 | 2026-11-10 | Still underwater 51 calendar days through 2026-11-11 |
| ETH / 90d | -26.04% | 2026-09-21 | 2026-11-10 | Still underwater 51 calendar days through 2026-11-11 |
30 days: 2026-10-13 to 2026-11-11 UTC, using the 2026-10-12 close as the initial boundary.
90 days: 2026-08-14 to 2026-11-11 UTC, using the 2026-08-13 close as the initial boundary.
Maximum drawdown is the largest close-to-close loss from a running high within each window, not an all-time high. Equal-depth losses use the earliest trough. Recovery is the first subsequent daily close at or above that episode's peak, measured in calendar days from peak; “still underwater” means that peak was not regained by the named endpoint, even if price has risen from the trough. Flat or rising-only windows have no loss episode. Both coins need every daily boundary; a missing or invalid close makes that comparison unavailable. These historical losses are not forecasts or safety ratings. Follow each coin's link for its drawdown history.
ETH on Bitcoin's green and red days
Binance spot USDT daily closes. Completed UTC days through . Historical spot returns, separate from the current perpetual-market KPIs above.
| Window | BTC days | Count | Mean BTC return | Mean ETH return | ETH beat BTC |
|---|---|---|---|---|---|
| 30 days | Positive | 14 | +1.02% | +1.21% | 57.1% |
| 30 days | Negative | 16 | -1.49% | -2.08% | 37.5% |
| 90 days | Positive | 47 | +1.55% | +1.87% | 55.3% |
| 90 days | Negative | 43 | -1.29% | -1.75% | 37.2% |
30 days: 2026-10-13 to 2026-11-11 UTC, using the 2026-10-12 close as the baseline. Flat BTC days excluded: 0.
90 days: 2026-08-14 to 2026-11-11 UTC, using the 2026-08-13 close as the baseline. Flat BTC days excluded: 0.
Simple close-to-close returns from each day's 23:00 UTC hourly candle. Positive and negative refer to BTC's return; flat BTC days belong to neither group. “Beat BTC” means a strictly higher return, including a smaller loss; ties do not count. Each group needs at least 5 observations over 30 days or 10 over 90 days. Missing daily closes make that window unavailable. These are historical sample means, not a forecast or hedge recommendation.
BTC vs ETH price, rebased to 100
Loading chart…
Not recorded Chart: TradingView Lightweight Charts™
BTC vs ETH open interest, rebased to 100
Loading chart…
Not recorded Chart: TradingView Lightweight Charts™
How it's counted. Price is each coin's largest perpetual market by open interest. Open interest and 24h volume are summed over every exchange tracked; funding is the OI-weighted average per 8 hours. Liquidations are the coin's long and short liquidations in the last 24h across the exchanges that publish them. Returns, correlation, beta and volatility use Binance USDT perpetual daily candles. Returns compare the latest completed UTC close with the close 7, 30 or 90 days earlier; correlation and beta use daily log returns. Missing daily closes leave a dash. The charts divide each coin's hourly price or open interest by its value at the start of the range, so both lines start at 100.
BTC vs ETH FAQ
Which has more open interest, BTC or ETH?
BTC has more: $21.21B of open interest against $11.40B for ETH, summed over every exchange tracked.
How correlated are BTC and ETH?
30-day correlation: 0.94; 90-day correlation: 0.90. Pearson correlation of daily log returns from Binance USDT perpetual closes, using completed UTC days, as in the correlation matrix. Here each window needs every daily close; a dash means candles are missing, short or flat. ETH's 90-day beta to BTC is 1.26: covariance of its daily log returns with BTC divided by the variance of BTC's returns.
What does the rebased BTC vs ETH chart show?
Both coins' price (or open interest) divided by its value at the start of the range and multiplied by 100, so both lines start at 100. A line at 110 is up 10% over the range, which makes coins of very different prices comparable on one axis.
How is 30-day volatility calculated?
Realised volatility: the standard deviation of the last 30 daily log returns of the Binance USDT perpetual, annualised with the square root of 365. The volatility screener ranks the top 100 coins by it.