TSLAB live: price, volume & volume spikes
Share: Share on X Telegram Reddit Download the 1200×630 card
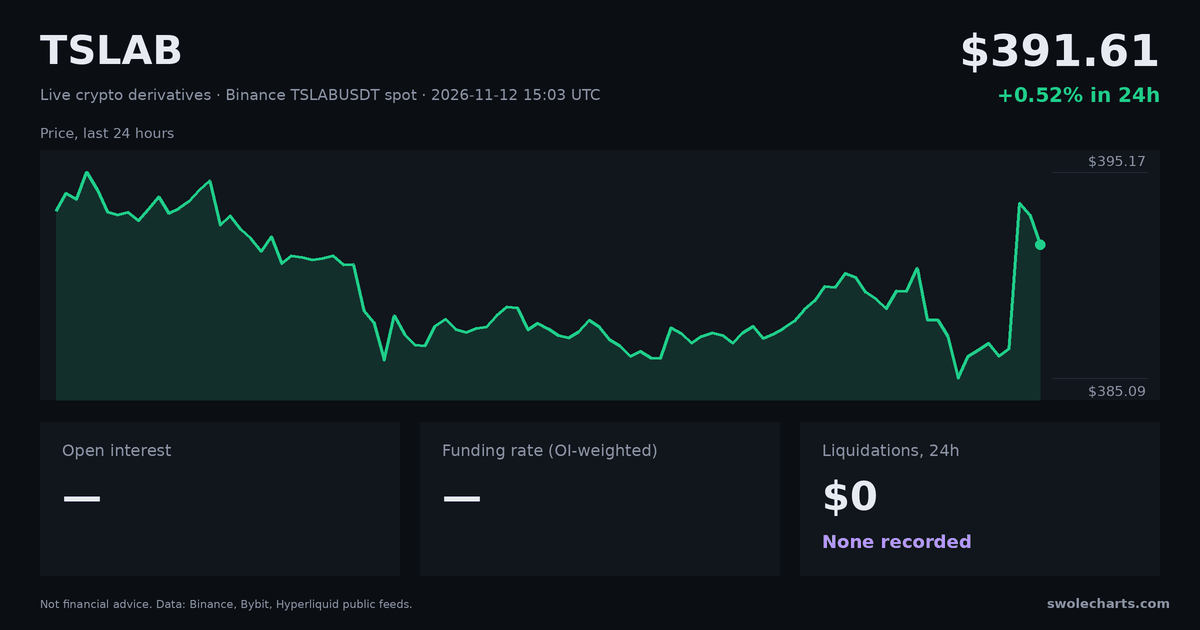
Live market summary
TSLAB trades on 1 exchange tracked by Swolecharts (Binance) across 1 spot market (no perpetual futures). The last price is 395.44 USDT on Binance (+2.08% in the last hour), and 24h volume is $3.44M. With no perpetual futures listed, there is no funding rate, open interest or liquidation data for TSLAB. The scanner flagged 14 volume spikes on TSLAB in the last 24 hours.
TSLAB price
Loading chart…
Not recorded Chart: TradingView Lightweight Charts™
TSLAB CVD and taker flow
Spot vs perp, from range start · bars: net taker buysLoading chart…
Not recorded Chart: TradingView Lightweight Charts™
TSLAB markets: funding rate & open interest by exchange
Funding as 8h equivalent (hover for APR) · OI changes need history| Market | Price | Price 1h | Price 24h | 24h volume | Funding 8h | Open interest, USD | OI 1h | OI 4h | OI 24h | Trade |
|---|---|---|---|---|---|---|---|---|---|---|
| BinancespotTSLABUSDT | 395.44 | +2.08% | +1.62% | $3.44M | — | — | — | — | — | Trade |
Trade links go to the exchange and may be referral links.
TSLAB volume spikes
See live spikes for all coins →| Time | Venue | Type | Side | $ in 1m | × normal | Buy % | +5m | +15m | +1h |
|---|---|---|---|---|---|---|---|---|---|
| 25m ago | BIN spot | VOL | BUY | $38K | 27.1× | 64% | +0.52% | +0.29% | — |
Newest first, up to 100. +5m / +15m / +1h show the price change after each spike and fill in as time passes. They describe the past, not a prediction.
TSLAB spike outcomes: how often price kept going 5, 15 and 60 minutes after a spike →
TSLAB liquidations: long vs short
All liquidations →TSLAB has no perpetual futures on the tracked exchanges, so there are no liquidations, funding or open interest to show.
About the TSLAB numbers
TSLAB volume spikes
A spike is a minute where one TSLAB market traded at least 4× its normal minute volume, with a size floor. Buy % is the share of taker buys. The +5m / +15m / +1h columns show what price did afterwards. They are history, not a signal. Not financial advice.