Optimism (OP) volume spikes live
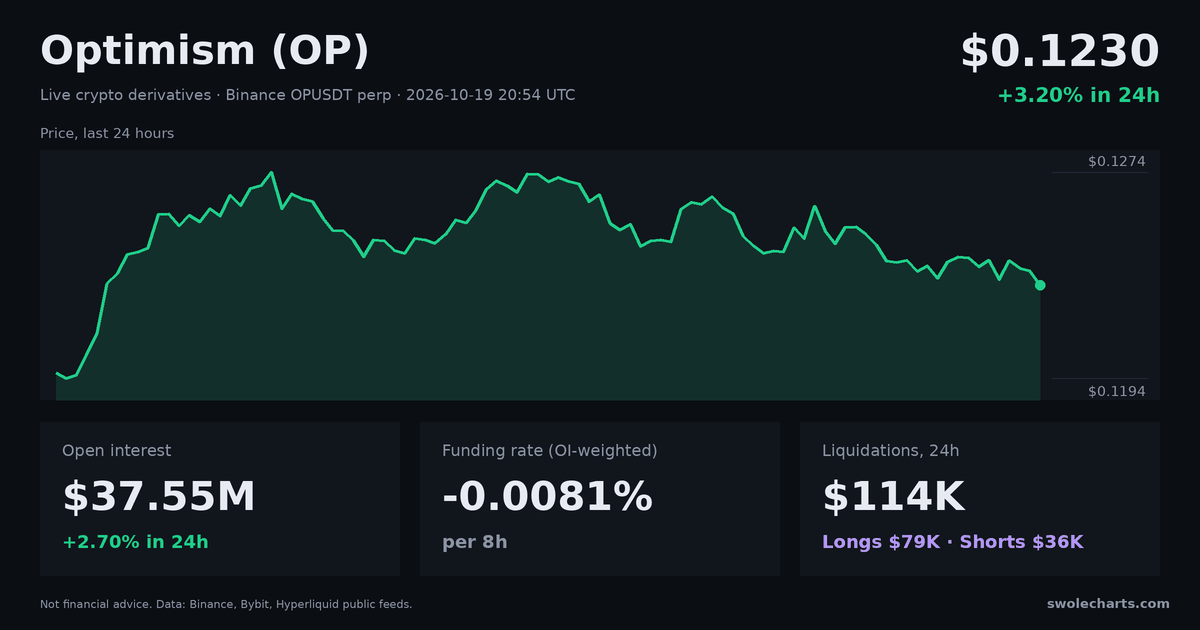
The scanner's live list holds 15 recent OP volume spikes (38 in the last 24 hours): 4 buy-side and 10 sell-side, plus 1 mixed. The largest was $398K traded in one minute on Binance perp (35.1× normal, sell-side), 37m ago. Fifteen minutes after buy-side spikes, price moved -0.84% on average (higher in 0% of 3). Fifteen minutes after sell-side spikes, price moved -0.21% on average (lower in 40% of 10).
Share: Share on X Telegram Reddit Download the 1200×630 card
Measured listed spikes
What OP price did after each spike
Listed spikes only · average change · share that moved in the spike's direction · measured sample size| Spike side | Listed spikes | After 5 min | After 15 min | After 1 hour |
|---|---|---|---|---|
| BUY | 4 | -0.72% 0% up · n=4 | -0.84% 0% up · n=3 | — |
| SELL | 10 | -0.01% 60% down · n=10 | -0.21% 40% down · n=10 | -0.48% 67% down · n=6 |
Outcomes use only the spikes in the live list, not every spike in the 24h total. They fill in 5, 15 and 60 minutes after each spike, measured from the spike minute's close on the same market. A dash means pending or unavailable; n counts measured outcomes, including zero moves. Small samples are noisy, and past moves are not a prediction.
OP volume spike history
See live spikes for all coins →| Time | Venue | Type | Side | $ in 1m | × normal | Buy % | +5m | +15m | +1h |
|---|---|---|---|---|---|---|---|---|---|
| 12m ago | BIN perp | VOL | BUY | $76K | 4.9× | 92% | -0.21% | — | — |
| 35m ago | BIN spot | VOL | MIXED | $75K | 110.0× | 43% | +0.21% | +0.32% | — |
| 37m ago | BYB perp | VOL | SELL | $277K | 55.1× | 36% | -0.19% | -0.22% | — |
| 37m ago | BIN perp | VOL | SELL | $398K | 35.1× | 32% | -0.22% | -0.21% | — |
| 38m ago | BIN spot | VOL | BUY | $30K | 44.2× | 85% | -0.95% | -0.85% | — |
| 38m ago | BYB perp | VOL | BUY | $81K | 16.0× | 81% | -0.85% | -0.81% | — |
| 38m ago | BIN perp | VOL | BUY | $114K | 10.1× | 64% | -0.88% | -0.87% | — |
| 43m ago | BYB perp | VOL | SELL | $107K | 25.0× | 35% | -0.10% | -1.32% | — |
| 49m ago | BIN perp | VOL | SELL | $164K | 14.3× | 21% | +0.06% | -1.27% | — |
| 76m ago | BYB perp | VOL | SELL | $92K | 17.2× | 16% | +0.11% | +0.16% | -0.94% |
| 2h ago | BIN perp | VOL | SELL | $206K | 19.2× | 30% | +0.40% | +0.37% | +0.04% |
| 2h ago | BYB perp | VOL | SELL | $107K | 37.2× | 26% | +0.38% | +0.37% | +0.04% |
| 2h ago | BIN spot | VOL | SELL | $35K | 124.2× | 31% | -0.21% | 0.00% | -0.63% |
| 2h ago | BYB perp | VOL | SELL | $108K | 53.1× | 23% | -0.14% | +0.02% | -0.66% |
| 2h ago | BIN perp | VOL | SELL | $165K | 19.6× | 32% | -0.18% | 0.00% | -0.70% |
Live list: recent alerts across all coins, up to 100 for this coin, newest first. The 24h count also includes spikes outside this list. +5m / +15m / +1h are measured price changes, not predictions.
OP spike outcomes: how often price kept going 5, 15 and 60 minutes after a spike →
Subscribe to OP volume spikes via RSS: newest 30 matching recorded events within 24h; frequent activity can exceed this reader window. Defaults: all directions, 5× the scanner baseline. Use direction=all|buy|sell|mixed and multiple=3|5|10, for example buy spikes at 5× or more. The multiple measures volume, not price gain; delivery is not guaranteed in realtime.
Bybit Trade on Bybit
No account yet? Signing up through our link helps keep Swolecharts free.
Referral link · availability depends on your country (not available in the US)
HL New to Hyperliquid?
Code VOLUMEMONITOR saves 4% on fees for your first $25M of volume. New wallets only: use it before your first trade.
Referral link · availability depends on your country
OP volume
Spot + perp, USDLoading chart…
Not recorded Chart: TradingView Lightweight Charts™
About the OP volume spikes
What is a OP volume spike?
A minute in which one OP market (spot or perp, on Binance, Bybit and Hyperliquid) trades at least 4× its normal minute volume, where normal is the median of the previous hour, with a size floor ($30K spot, $75K perps) so thin trading doesn't count.
How to read it
Buy % is the share of taker buys in the minute: 60% or more is a buy-side spike, 40% or less sell-side. The +5m / +15m / +1h columns show what price did afterwards on the same market, and the table above averages them. Spikes at the same time on several exchanges carry more weight than one venue alone.
Is this a trading signal?
No. It is a record of unusual activity and what followed. Averages over a handful of spikes are noisy, and the list only holds the most recent spikes. Not financial advice. See live spikes for every coin.