MAGMA long/short ratio live
54.6% of Binance accounts with an open MAGMA position are net long, a MAGMA long/short ratio of 1.20 (+1.9 pp in 24 hours). On Bybit, 54.9% of users are long (ratio 1.22, +9.3 pp in 24 hours). New readings arrive every 5 minutes. That is about usual for MAGMA: the latest recorded hourly share of Binance and Bybit accounts net long (54.9% long) is higher than or equal to 61% of hourly readings since 18 Oct UTC (25 days of history), which ranged from 28.8% long to 66.1% long.
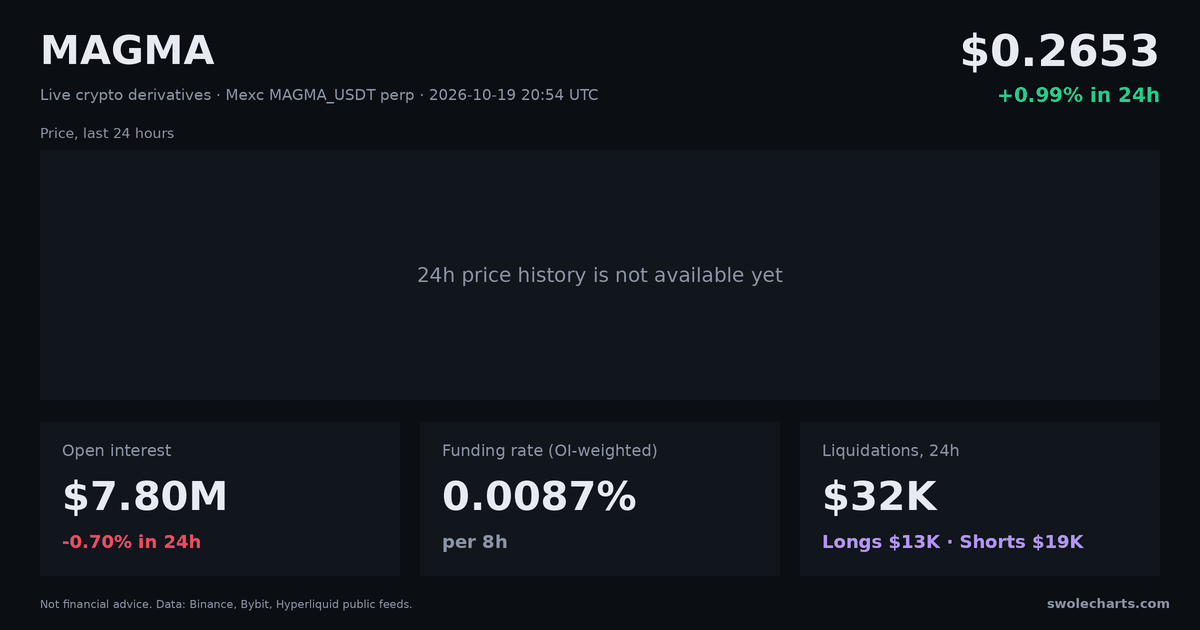
Share: Share on X Telegram Reddit Download the 1200×630 card
MAGMA long/short ratio
All coins' long/short ratios →| Series | Now | 24h |
|---|
Share of longs; changes in percentage points (pp). Accounts = share of accounts with a net long position; top trader accounts = the same for the exchange's top traders (Binance: top 20% by margin); top trader positions = share of their combined position that is long; top traders vs accounts = top trader positions long minus accounts long, in pp (negative: the big traders are less long than the crowd); taker buys = share of the last 5 minutes' taker volume that bought. New points every 5 minutes; 24h history backfilled from the exchanges. Gate, Bitget and HTX are tracked for the top 50 coins.
Bybit Trade on Bybit
No account yet? Signing up through our link helps keep Swolecharts free.
Referral link · availability depends on your country (not available in the US)
MAGMA long/short history
From recorded history, hourly54.8% of MAGMA trader accounts on Binance and Bybit are net long, down 6.6 points over the past 5 days (from 61.3%). Over the last 24 hours the share of MAGMA trader accounts net long moved to 54.9%, up 5.3 points from 49.6% the day before.
MAGMA long/short ratio
Binance and Bybit history from 2020Loading chart…
Not recorded Chart: TradingView Lightweight Charts™
MAGMA top traders vs all accounts
Top trader positions long minus accounts long, ppLoading chart…
Not recorded Chart: TradingView Lightweight Charts™
30 completed UTC days of account positioning
MAGMA Binance and Bybit accounts: daily mean long share; ratio derived from that share. Long and short percentages count accounts, not position size. L/S = long share / (1 − long share), not the mean of observation ratios or a closing ratio.
Newest UTC date first; today's unfinished day is excluded. Unavailable means no usable recorded share for that venue and date, or a history read failed. Gaps stay missing; exchanges are never averaged together. At 100% long, the L/S ratio is unavailable because short share is zero.
| UTC date | Binance accounts | Bybit accounts | ||||
|---|---|---|---|---|---|---|
| Long % | Short % | L/S ratio | Long % | Short % | L/S ratio | |
| 2026-11-15 | 56.18% | 43.82% | 1.28 | 49.95% | 50.05% | 1.00 |
| 2026-11-14 | 52.12% | 47.88% | 1.09 | 46.74% | 53.26% | 0.88 |
| 2026-11-13 | 50.05% | 49.95% | 1.00 | 44.71% | 55.29% | 0.81 |
| 2026-11-12 | 54.41% | 45.59% | 1.19 | 58.23% | 41.77% | 1.39 |
| 2026-11-11 | 54.79% | 45.21% | 1.21 | 67.69% | 32.31% | 2.09 |
| 2026-11-10 | 54.10% | 45.90% | 1.18 | 65.41% | 34.59% | 1.89 |
| 2026-11-09 | Unavailable | Unavailable | Unavailable | Unavailable | Unavailable | Unavailable |
| 2026-11-08 | 54.90% | 45.10% | 1.22 | 56.88% | 43.12% | 1.32 |
| 2026-11-07 | 54.79% | 45.21% | 1.21 | 54.60% | 45.40% | 1.20 |
| 2026-11-06 | 56.00% | 44.00% | 1.27 | 46.24% | 53.76% | 0.86 |
| 2026-11-05 | 52.22% | 47.78% | 1.09 | 40.50% | 59.50% | 0.68 |
| 2026-11-04 | 48.43% | 51.57% | 0.94 | 35.99% | 64.01% | 0.56 |
| 2026-11-03 | 46.37% | 53.63% | 0.86 | 32.08% | 67.92% | 0.47 |
| 2026-11-02 | 45.59% | 54.41% | 0.84 | 32.67% | 67.33% | 0.49 |
| 2026-11-01 | 47.05% | 52.95% | 0.89 | 36.72% | 63.28% | 0.58 |
| 2026-10-31 | 53.12% | 46.88% | 1.13 | 41.40% | 58.60% | 0.71 |
| 2026-10-30 | 53.47% | 46.53% | 1.15 | 47.09% | 52.91% | 0.89 |
| 2026-10-29 | 57.77% | 42.23% | 1.37 | 59.17% | 40.83% | 1.45 |
| 2026-10-28 | 52.08% | 47.92% | 1.09 | 58.60% | 41.40% | 1.42 |
| 2026-10-27 | 55.70% | 44.30% | 1.26 | 54.23% | 45.77% | 1.18 |
| 2026-10-26 | 60.18% | 39.82% | 1.51 | 49.70% | 50.30% | 0.99 |
| 2026-10-25 | 58.30% | 41.70% | 1.40 | 49.85% | 50.15% | 0.99 |
| 2026-10-24 | 60.05% | 39.95% | 1.50 | 50.76% | 49.24% | 1.03 |
| 2026-10-23 | 42.40% | 57.60% | 0.74 | 33.47% | 66.53% | 0.50 |
| 2026-10-22 | 43.00% | 57.00% | 0.75 | 38.80% | 61.20% | 0.63 |
| 2026-10-21 | 61.11% | 38.89% | 1.57 | 58.75% | 41.25% | 1.42 |
| 2026-10-20 | 62.72% | 37.28% | 1.68 | 63.85% | 36.15% | 1.77 |
| 2026-10-19 | 66.02% | 33.98% | 1.94 | 61.77% | 38.24% | 1.62 |
| 2026-10-18 | 68.12% | 31.88% | 2.14 | 61.78% | 38.22% | 1.62 |
| 2026-10-17 | Unavailable | Unavailable | Unavailable | Unavailable | Unavailable | Unavailable |
About the MAGMA long/short ratio
What is the MAGMA long/short ratio?
Binance accounts: the share of all accounts with an open position that are net long. Bybit accounts: the share of all accounts with an open position that are net long. For each denominator, long share divided by short share gives the ratio: 60% long is 1.50.
How to read it for MAGMA
Account ratios count people, not money, and retail accounts lean long most of the time, so the level alone says little. Look at changes (the crowd piling in or out) and at divergence between top traders and all accounts. Some traders fade extreme readings, since a crowded side can be squeezed, but that often fails. Not financial advice.
How often it updates
New observations are fetched every 5 minutes, with available 24-hour history backfilled from the exchanges. Coverage varies by exchange and series; missing current observations can reflect absent feed coverage, delays or expired readings. Compare all coins.