LITEB live: price, volume & volume spikes
Share: Share on X Telegram Reddit Download the 1200×630 card
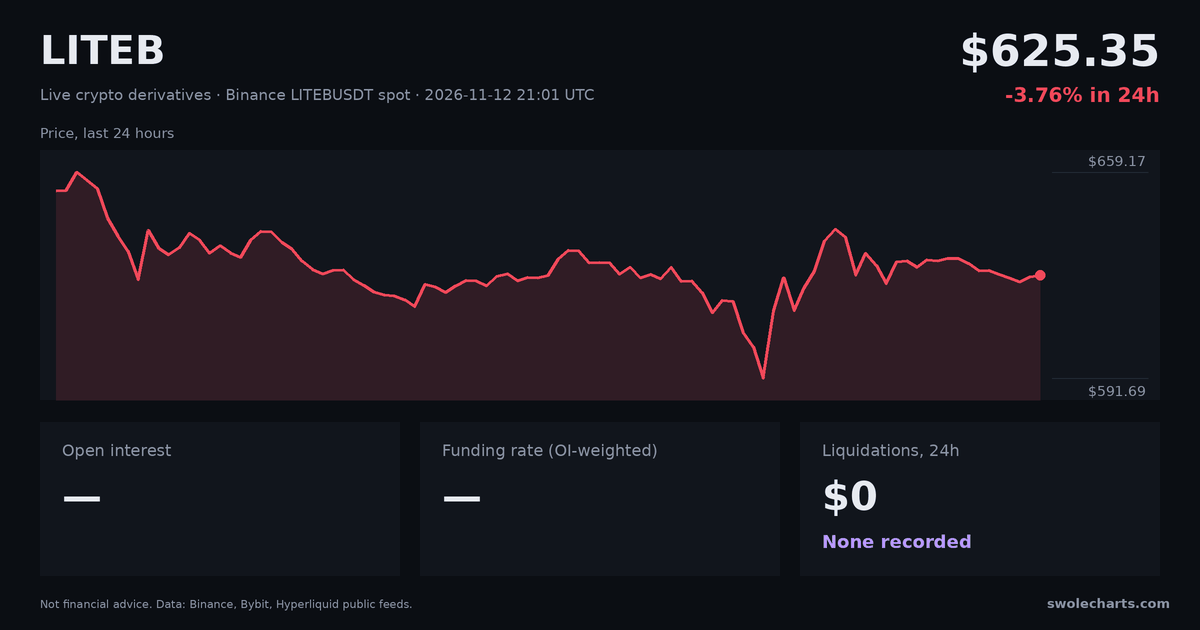
Live market summary
LITEB trades on 1 exchange tracked by Swolecharts (Binance) across 1 spot market (no perpetual futures). The last price is 624.77 USDT on Binance (-0.43% in the last hour), and 24h volume is $1.62M. With no perpetual futures listed, there is no funding rate, open interest or liquidation data for LITEB. The scanner flagged 2 volume spikes on LITEB in the last 24 hours.
LITEB price
Loading chart…
Not recorded Chart: TradingView Lightweight Charts™
LITEB CVD and taker flow
Spot vs perp, from range start · bars: net taker buysLoading chart…
Not recorded Chart: TradingView Lightweight Charts™
LITEB markets: funding rate & open interest by exchange
Funding as 8h equivalent (hover for APR) · OI changes need history| Market | Price | Price 1h | Price 24h | 24h volume | Funding 8h | Open interest, USD | OI 1h | OI 4h | OI 24h | Trade |
|---|---|---|---|---|---|---|---|---|---|---|
| BinancespotLITEBUSDT | 624.77 | -0.43% | -4.10% | $1.62M | — | — | — | — | — | Trade |
Trade links go to the exchange and may be referral links.
LITEB volume spikes
See live spikes for all coins →| Time | Venue | Type | Side | $ in 1m | × normal | Buy % | +5m | +15m | +1h |
|---|---|---|---|---|---|---|---|---|---|
| 3h ago | BIN spot | VOL | SELL | $78K | 288.1× | 0% | +0.07% | +1.47% | +1.55% |
| 4h ago | BIN spot | VOL | BUY | $55K | 163.0× | 100% | -0.20% | -0.88% | +0.15% |
Newest first, up to 100. +5m / +15m / +1h show the price change after each spike and fill in as time passes. They describe the past, not a prediction.
LITEB spike outcomes: how often price kept going 5, 15 and 60 minutes after a spike →
LITEB liquidations: long vs short
All liquidations →LITEB has no perpetual futures on the tracked exchanges, so there are no liquidations, funding or open interest to show.
About the LITEB numbers
LITEB volume spikes
A spike is a minute where one LITEB market traded at least 4× its normal minute volume, with a size floor. Buy % is the share of taker buys. The +5m / +15m / +1h columns show what price did afterwards. They are history, not a signal. Not financial advice.