Initia (INIT) live: funding rate, open interest, liquidations & volume spikes
Share: Share on X Telegram Reddit Download the 1200×630 card
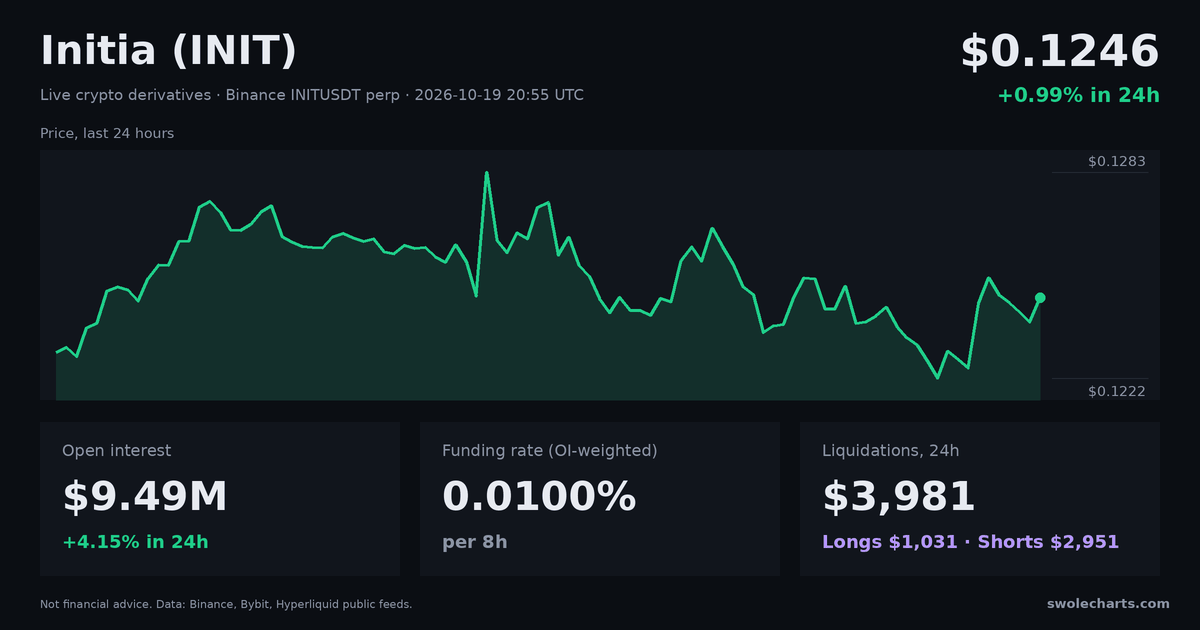
Listed in today's movers: #4 price loser, #4 most negative funding
Since yesterday
OI 24h: now vs 24h ago. Funding 24h: mean 8h-equivalent rate, last 24h vs the 24h before, hourly recorded history. Long accounts 24h: latest vs 24h earlier, hourly recorded history. Liquidations 24h: last 24h vs the 24h before, hourly recorded history. Recorded, refreshed every 15 minutes.
Live market summary
INIT trades on 9 exchanges tracked by Swolecharts (Aster, Binance, Bitget, Bybit, Gate, HTX, Hyperliquid, KuCoin and MEXC) across 9 perpetual futures and 3 spot markets. The last price is 0.1277 USDT on Binance (-0.23% in the last hour), and 24h volume is $516.09M ($491.74M perps, $24.36M spot). Perpetual open interest totals $17.31M. The OI-weighted funding rate is -0.4470% per 8h (≈-489% APR), so shorts pay longs. $2.00M of INIT positions were liquidated on Binance, Bybit, Gate, Bitget, Aster and HTX in the last 24 hours, 68% longs and 32% shorts. The scanner flagged 84 volume spikes on INIT in the last 24 hours.
INIT open interest, funding, liquidations and long/short history
· From recorded history, hourly
INIT open interest is $17.31M, up 78.1% over the past 7 days, and down 20.9% in the last 24 hours. INIT recorded funding quotes have averaged -1.4812% per 8 hours over the past 7 days (≈-1622% APR, annualized quote). Recorded hourly quote readings were 31% positive, 69% negative and 0% zero. $14.33M of INIT positions were liquidated over the past 7 days: $6.15M longs (42.9%) and $8.17M shorts. The biggest hour was 14:00 UTC on 10 Nov, with $1.54M. 53.4% of INIT trader accounts on Binance and Bybit are net long, up 11.5 points over the past 7 days (from 41.9%).
INIT price
Loading chart…
Not recorded Chart: TradingView Lightweight Charts™
INIT open interest
All perps, USDLoading chart…
Not recorded Chart: TradingView Lightweight Charts™
INIT funding rate
OI-weighted, 8hLoading chart…
Not recorded Chart: TradingView Lightweight Charts™
INIT liquidations
Longs up, shorts downLoading chart…
Not recorded Chart: TradingView Lightweight Charts™
INIT long/short ratio
Share long · Binance and Bybit history from 2020Loading chart…
Not recorded Chart: TradingView Lightweight Charts™
INIT CVD and taker flow
Spot vs perp, from range start · bars: net taker buysLoading chart…
Not recorded Chart: TradingView Lightweight Charts™
INIT markets: funding rate & open interest by exchange
Funding as 8h equivalent (hover for APR) · OI changes need history| Market | Price | Price 1h | Price 24h | 24h volume | Funding 8h | Open interest, USD | OI 1h | OI 4h | OI 24h | Trade |
|---|---|---|---|---|---|---|---|---|---|---|
| BinanceperpINITUSDT | 0.1277 | -0.23% | -22.56% | $336.03M | -0.4784% | $9.67M | -1.40% | -1.55% | -26.96% | Trade |
| MEXCperpINIT_USDT | 0.1277 | +0.25% | -22.21% | $9.71M | -0.4776% | $5.93M * | -2.68% | -7.88% | -27.66% | Trade |
| BybitperpINITUSDT | 0.1279 | -0.03% | -24.80% | $74.32M | -0.7962% | $2.81M | +1.05% | +6.78% | -11.28% | Trade |
| KuCoinperpINITUSDTM | 0.1280 | +0.26% | -24.15% | $8.73M | -0.1544% | $1.98M | +7.98% | +15.71% | -22.09% | Trade |
| GateperpINIT_USDT | 0.1270 | +0.24% | -22.94% | $17.67M | -0.1488% | $1.33M | -1.28% | +3.47% | +5.55% | Trade |
| BitgetperpINITUSDT | 0.1270 | +0.09% | -23.70% | $32.93M | -0.4072% | $778K | +1.35% | -1.75% | -17.12% | Trade |
| HyperliquidperpINIT | 0.1271 | +0.28% | -22.33% | $11.97M | -0.0599% | $694K | -1.93% | -8.44% | -15.84% | Trade |
| AsterperpINITUSDT | 0.1281 | -0.27% | -23.71% | $320K | -0.2930% | $31K | -0.85% | -6.65% | -39.30% | Trade |
| HTXperpINIT-USDT | 0.1279 | +0.19% | -22.68% | $379K | -0.0189% | $14K | +5.44% | +55.55% | +421.09% | Trade |
| BinancespotINITUSDT | 0.1289 | -0.22% | -24.43% | $22.60M | — | — | — | — | — | Trade |
| BybitspotINITUSDT | 0.1276 | +0.77% | -23.96% | $1.35M | — | — | — | — | — | Trade |
| BinancespotINITUSDC | 0.1289 | -0.57% | -25.47% | $408K | — | — | — | — | — | Trade |
Trade links go to the exchange and may be referral links.
Bybit Trade on Bybit
No account yet? Signing up through our link helps keep Swolecharts free.
Referral link · availability depends on your country (not available in the US)
HL New to Hyperliquid?
Code VOLUMEMONITOR saves 4% on fees for your first $25M of volume. New wallets only: use it before your first trade.
Referral link · availability depends on your country
INIT long/short ratio Unusually high · 18d, 95th percentile of the last 18 days
All coins' long/short ratios →| Series | Now | 24h |
|---|---|---|
| Gate top traders vs accounts | -0.7 pp | — |
| Gate accounts | 51.0% | +5.3 |
| Gate top trader accounts | 25.4% | -14.9 |
| Gate top trader positions | 50.4% | -3.5 |
| Bitget accounts | 54.0% | +8.3 |
| HTX top trader accounts | 30.2% | -19.8 |
| HTX top trader positions | 50.0% | 0.0 |
Share of longs; changes in percentage points (pp). Accounts = share of accounts with a net long position; top trader accounts = the same for the exchange's top traders (Binance: top 20% by margin); top trader positions = share of their combined position that is long; top traders vs accounts = top trader positions long minus accounts long, in pp (negative: the big traders are less long than the crowd); taker buys = share of the last 5 minutes' taker volume that bought. New points every 5 minutes; 24h history backfilled from the exchanges. Gate, Bitget and HTX are tracked for the top 50 coins.
INIT volume spikes
See live spikes for all coins →| Time | Venue | Type | Side | $ in 1m | × normal | Buy % | +5m | +15m | +1h |
|---|---|---|---|---|---|---|---|---|---|
| 36m ago | BYB perp | FUND | BUY | — | — | — | — | — | — |
| 64m ago | BIN perp | VOL | MIXED | $311K | 4.2× | 58% | -0.86% | -2.69% | -1.30% |
| 77m ago | gate perp | FUND | BUY | — | — | — | — | — | — |
| 77m ago | BIN spot | VOL | MIXED | $40K | 9.3× | 58% | +0.57% | +2.28% | +1.71% |
| 78m ago | BYB perp | VOL | SELL | $104K | 4.9× | 31% | -0.11% | +2.77% | +1.40% |
| 78m ago | BIN perp | VOL | SELL | $370K | 5.0× | 24% | -0.02% | +2.84% | +1.30% |
| 2h ago | kucoin perp | FUND | BUY | — | — | — | — | — | — |
Newest first, up to 100. +5m / +15m / +1h show the price change after each spike and fill in as time passes. They describe the past, not a prediction.
INIT spike outcomes: how often price kept going 5, 15 and 60 minutes after a spike →
INIT liquidations: long vs short
All liquidations →| Window | Longs | Shorts | Long / short | Count |
|---|---|---|---|---|
| 1h | $9,860 | $3,408 | 49 | |
| 4h | $43K | $22K | 148 | |
| 24h | $1.37M | $636K | 2759 |
Biggest INIT liquidations, 24h
- GATESHORT$11K@ 0.139410h ago
- BINSHORT$11K@ 0.141710h ago
- BINLONG$7,699@ 0.139119h ago
- BINLONG$7,392@ 0.153922h ago
- BINLONG$6,170@ 0.13188h ago
Latest
- BINLONG$3@ 0.12786m ago
- BINLONG$70@ 0.12776m ago
- BYBSHORT$238@ 0.131811m ago
- BINSHORT$885@ 0.128411m ago
- BINSHORT$402@ 0.128112m ago
- BINLONG$12@ 0.143113m ago
From the public liquidation feeds of Binance, Bybit, Gate, Bitget, Aster and HTX. MEXC, KuCoin and Hyperliquid do not publish liquidations, so INIT perps there are not counted. Binance, Bitget and Aster publish only a sample of liquidations (Binance at most one per symbol per second), so totals are a lower bound. A long liquidation is a forced sell; a short liquidation is a forced buy.
About the INIT numbers
INIT funding rate
Perpetual futures have no expiry, so exchanges keep their price close to spot with periodic funding payments between longs and shorts. A positive INIT funding rate means longs pay shorts (more demand for leveraged longs); negative means shorts pay longs. Rates here are converted to an 8-hour equivalent so exchanges with 1h, 4h and 8h intervals compare directly, and the headline figure is weighted by each exchange's open interest.
INIT open interest
Open interest is the USD value of all open INIT perpetual positions. Rising OI alongside a price move means new positions are opening; falling OI means positions are closing (including liquidations). OI changes are measured from 5-minute snapshots.
INIT liquidations
A liquidation is a leveraged position the exchange closed by force. Long liquidations are forced sells that hit when price drops; short liquidations are forced buys when price rises. The long/short split shows which side was caught.
INIT long/short ratio
The share of traders long versus short on INIT perpetuals. Accounts figures count each account once (the share with a net long position on Binance, or holding a long on Bybit); the Binance top traders figure is the share of the combined position of the top 20% of Binance traders by margin that is long. A ratio above 1 means more longs than shorts. Retail account ratios lean long most of the time, so changes and divergences say more than the level. See the INIT long/short ratio page.
INIT volume spikes
A spike is a minute where one INIT market traded at least 4× its normal minute volume, with a size floor. Buy % is the share of taker buys. The +5m / +15m / +1h columns show what price did afterwards. They are history, not a signal. Not financial advice.