Volume Monitor
Live crypto data · 9 exchanges

Crypto derivatives reports

One report per half-year and per year, published the day after the period ends: perpetual futures open interest, funding, liquidations and volume by coin and exchange, plus Hyperliquid's share, with a shareable card and a CSV of every table.

18 reports so far, newest first: open interest, funding, liquidations, volume and Hyperliquid for each half-year and year, built from data stored since 20 July 2020. The next report, H2 2026, appears on 1 January 2027.

Latest report: H1 2026

Read the report
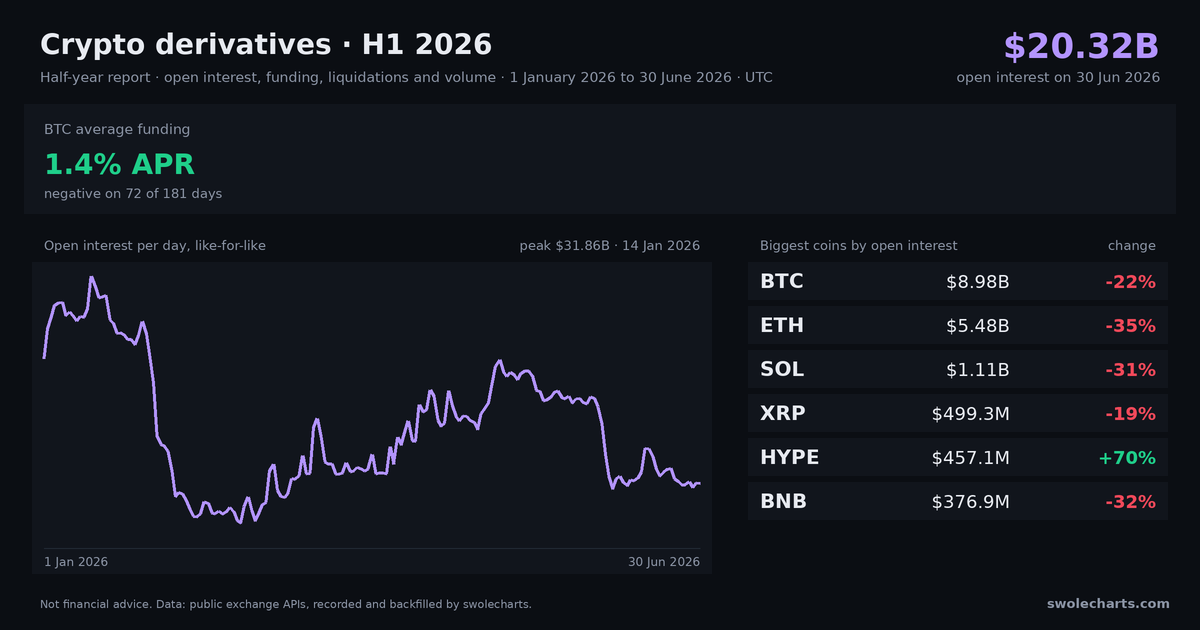
Crypto derivatives report H1 2026

Every report has a permanent page, a 1200×630 card at the same address plus .png and a CSV of each table, free to share with a link back.

All reports

newest first · UTC
Report Type Period Days with data
H1 2026 Half-year 1 Jan 2026 to 30 Jun 2026 100%
2025 Annual 1 Jan 2025 to 31 Dec 2025 100%
H2 2025 Half-year 1 Jul 2025 to 31 Dec 2025 100%
H1 2025 Half-year 1 Jan 2025 to 30 Jun 2025 100%
2024 Annual 1 Jan 2024 to 31 Dec 2024 100%
H2 2024 Half-year 1 Jul 2024 to 31 Dec 2024 100%
H1 2024 Half-year 1 Jan 2024 to 30 Jun 2024 100%
2023 Annual 1 Jan 2023 to 31 Dec 2023 100%
H2 2023 Half-year 1 Jul 2023 to 31 Dec 2023 100%
H1 2023 Half-year 1 Jan 2023 to 30 Jun 2023 100%
2022 Annual 1 Jan 2022 to 31 Dec 2022 100%
H2 2022 Half-year 1 Jul 2022 to 31 Dec 2022 100%
H1 2022 Half-year 1 Jan 2022 to 30 Jun 2022 100%
2021 Annual 1 Jan 2021 to 31 Dec 2021 100%
H2 2021 Half-year 1 Jul 2021 to 31 Dec 2021 100%
H1 2021 Half-year 1 Jan 2021 to 30 Jun 2021 100%
2020 partial Annual 1 Jan 2020 to 31 Dec 2020 45%
H2 2020 Half-year 1 Jul 2020 to 31 Dec 2020 90%

The next report, H2 2026, appears on 1 January 2027. Until then see the monthly liquidation reports.

Derivatives report FAQ

What does the derivatives report cover?

Perpetual futures open interest, funding, liquidations and trading volume over one half-year or year, by coin and by exchange, with a section on Hyperliquid. Every number comes from the exchanges' public market-data APIs, recorded by this site or backfilled from the exchanges' own history.

When is a report published?

At 00:00 UTC on the day after the period ends: 1 July for the first half, 1 January for the second half and the full year. Late data can still arrive during the first day, after which the report does not change.

Why do some sections cover fewer exchanges?

Coverage grows over time. Older periods rely on the hourly history Binance and Bybit publish (open interest) and on settled funding from Binance and Hyperliquid; every exchange on the coverage page is included from the day this site started recording it. Each section lists the exchanges it covers, and the open-interest change compares only exchanges recorded at both ends of the period.

Can I cite or share the report?

Yes. Each report has a permanent page, a 1200×630 image at the same address plus .png and a CSV of every table. Please link back to the page when you use the numbers or the image.